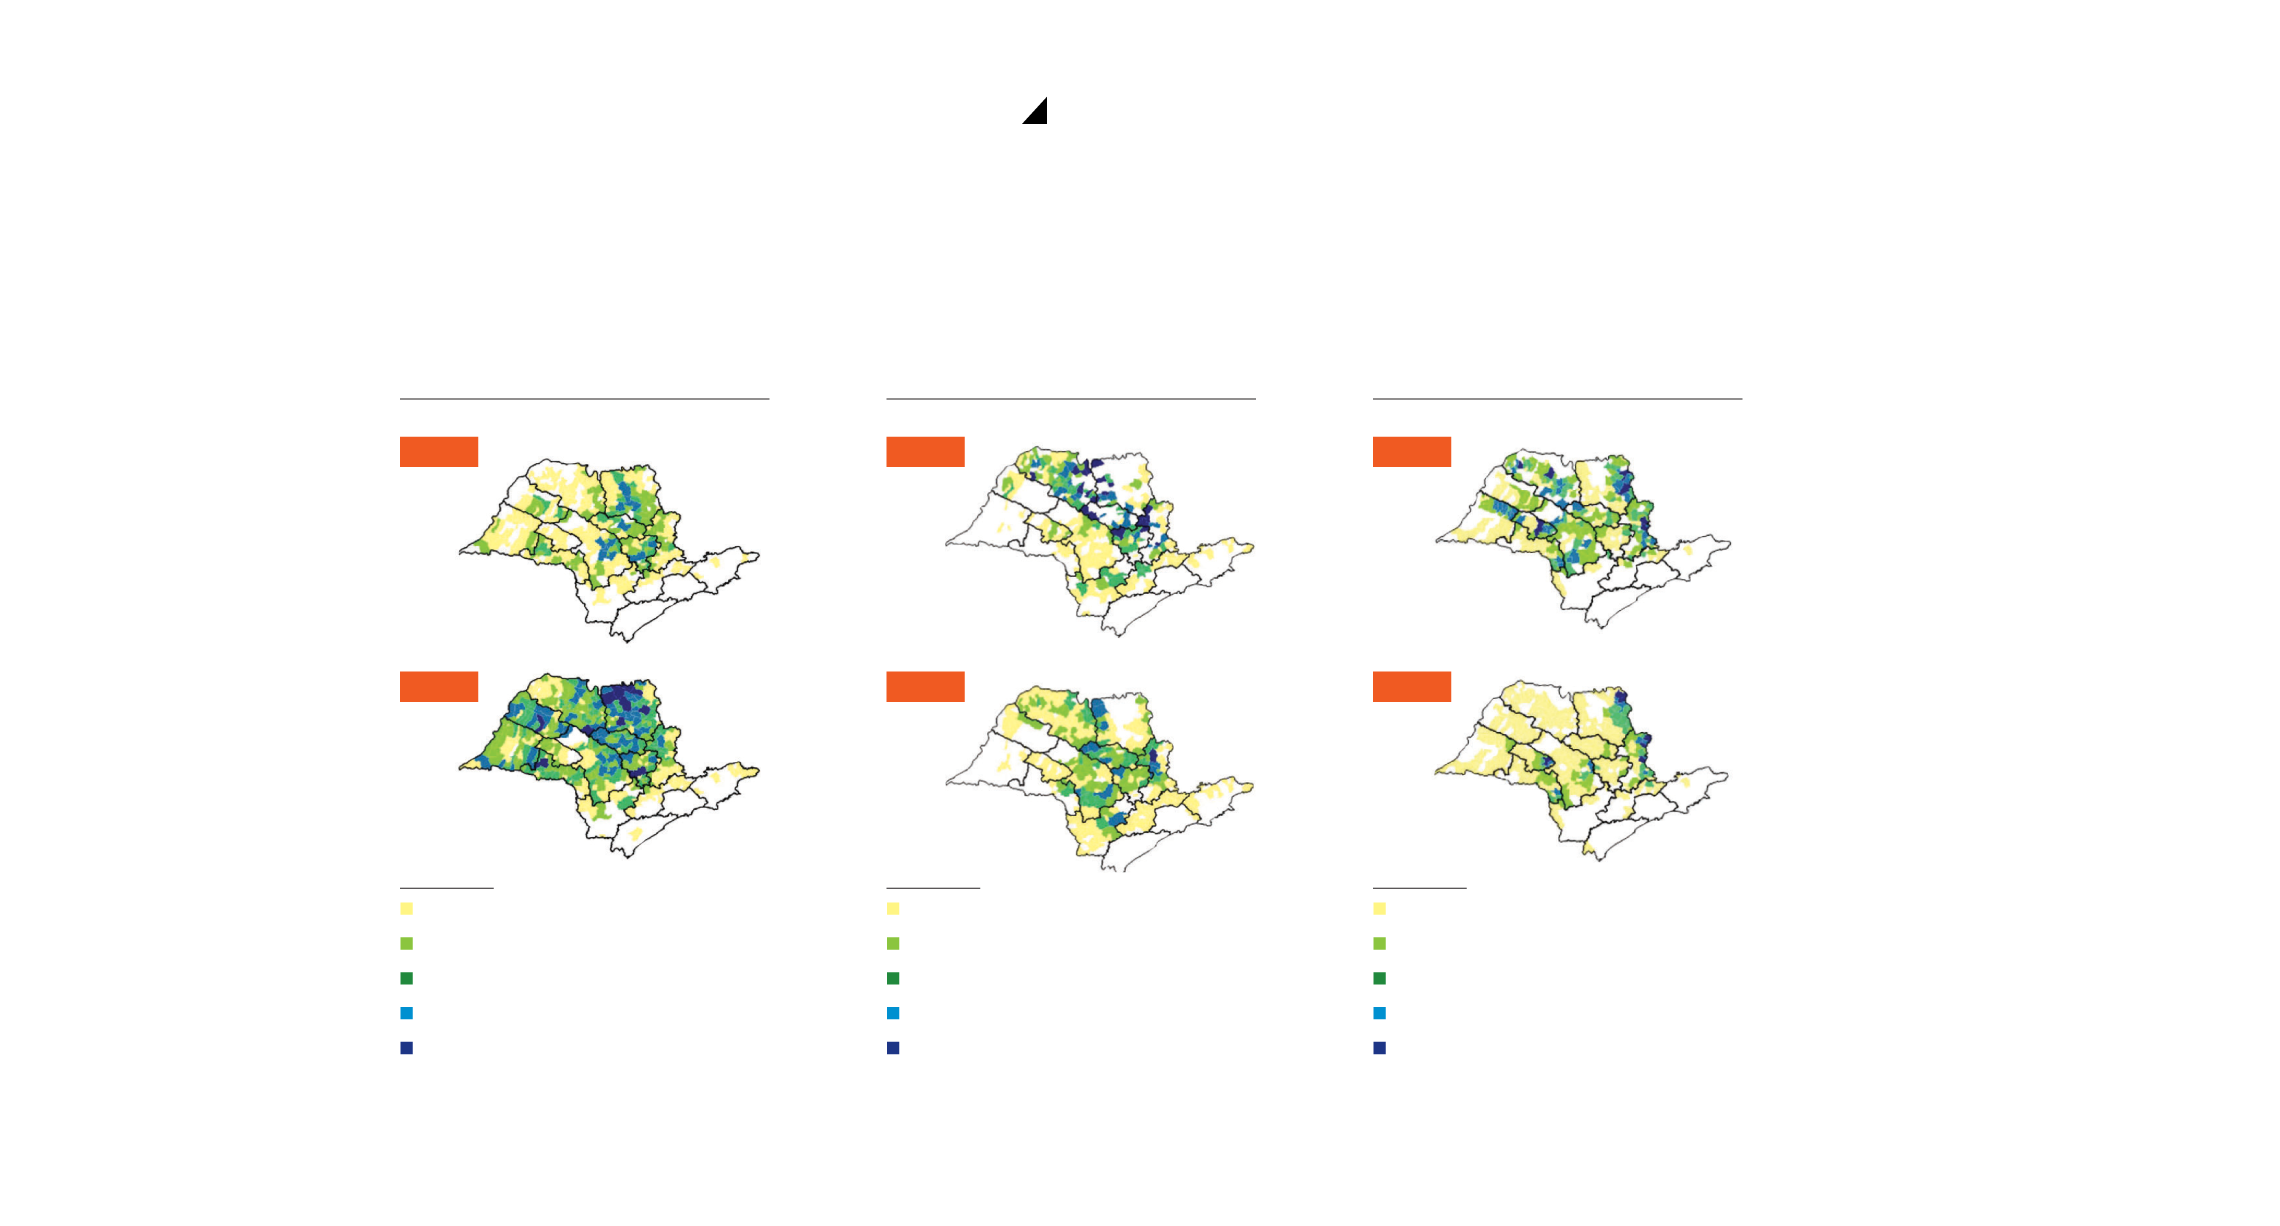
A changing crop landscape
A comparison of municipal production of sugarcane, oranges, and coffee in 1990 and 2012, in metric tons
SUGARCANE
COFFEE
ORANGES
1990
1990
1990
2012
2012
2012
Metric tons
Metric tons
Metric tons
300 – 384,995
2 – 25,745
1 – 558
384,995 – 1,020,000
25,746 – 81,600
559 – 1,836
1,020,000 – 1,908,000
81,601 – 200,000
1,837 – 4,158
1,908,001 – 3,273,520
200,001 – 448,800
4,159 – 9,047
3,273,521 – 7,963,342
448,801 – 693,690
9,048 – 16,330
SOURCE IBGE
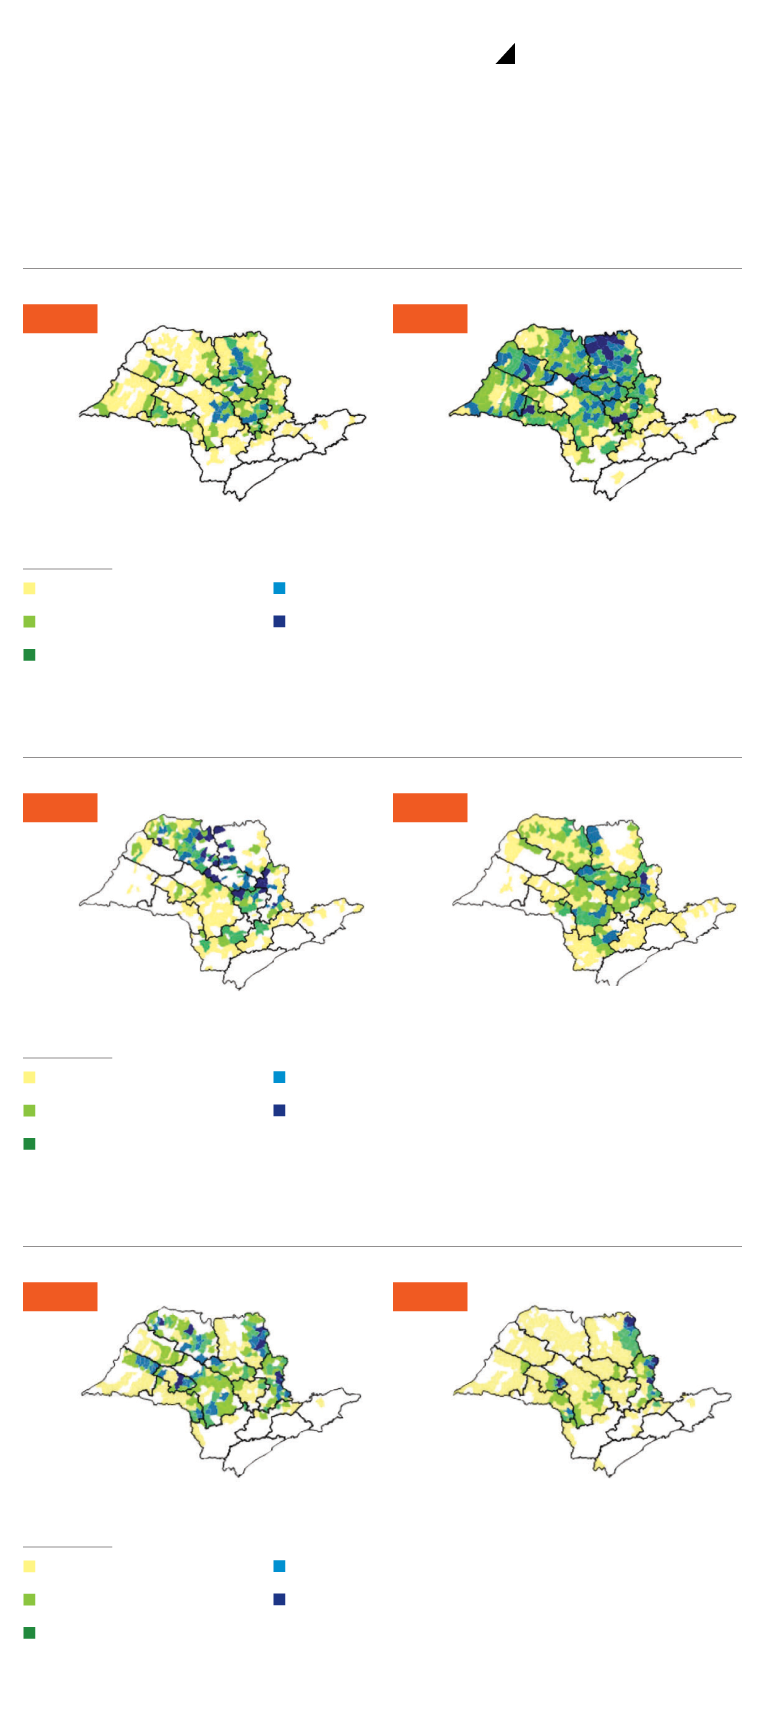
A changing crop landscape
A comparison of municipal production of sugarcane, oranges, and coffee in 1990 and 2012, in metric tons
SUGARCANE
1990
2012
Metric tons
1,908,001 – 3,273,520
300 – 384,995
3,273,521 – 7,963,342
384,995 – 1,020,000
1,020,000 – 1,908,000
ORANGES
1990
2012
Metric tons
200,001 – 448,800
2 – 25,745
448,801 – 693,690
25,746 – 81,600
81,601 – 200,000
COFFEE
1990
2012
Metric tons
4,159 – 9,047
1 – 558
9,048 – 16,330
559 – 1,836
1,837 – 4,158
SOURCE IBGE