- The year 2022 marked 10 years since Brazil passed its quota law1 for federal higher education institutions to increase the number of students enrolling from the public school system and the number of Black, multiracial, and Indigenous students
- The process, which began a decade earlier, culminated in the law that led several higher education institutions, notably public ones, to establish affirmative action programs with the aim of expanding access to higher education for disadvantaged groups
DATOS
Inclusion in university and higher education for young adults

- The law had an impact on all systems, but affected public institutions2 the most, as shown by the change in the proportion of each group graduating3 between 2011 and 2021
- Of all graduates, the proportion who declared themselves Black, multiracial, or Indigenous rose from 32% to 45%. In the federal system, the participation of minority groups increased from 39% to 52% and in the state system, from 33% to 41%.
- For-profit and nonprofit (FP and NFP) private institutions, despite not being covered by the law, felt the effects of other federal programs, such as scholarships (PROUNI) and grants (FIES), which also led to greater inclusion for minority groups by alleviating economic disadvantages

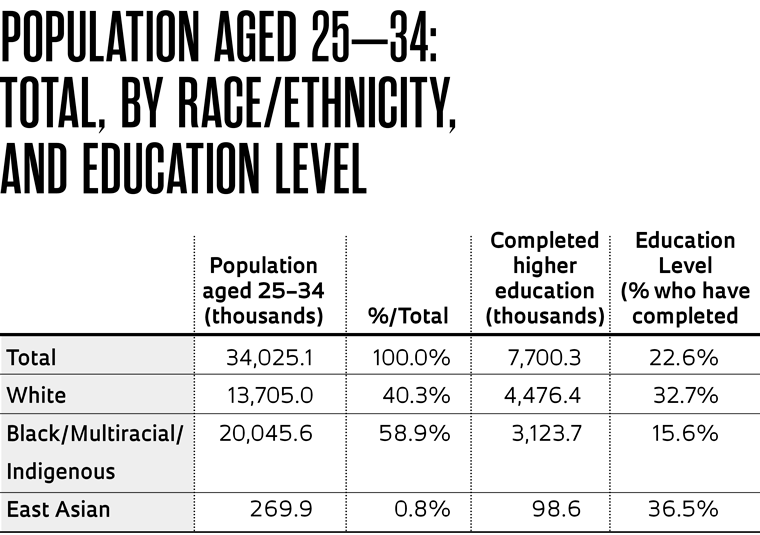
- Despite the progress, data from Brazil’s Ministry of Education show that in 2023, of the entire population of people aged 25 to 344, 59% declared themselves Black, multiracial, or Indigenous5, meaning these groups are not yet fully represented in higher education
- Furthermore, of all the people in this age group, 23% had a degree, but the proportion was 33% among people who declared themselves as White and only 16% among those who said they were Black, multiracial, or Indigenous, showing that there is still a long way to go
Notes (1) Federal Law no. 12.711/2012 of 08/29/2012 (2) The municipal system also underwent a similar change, but it was left out of the graph as it was not significant in absolute numbers (only 11,500 graduates who declared their ethnicity/race in 2021) (3) Graduates who declared their ethnicity/race (4) The youngest age group covered by higher education analyses in international comparisons (5) Data from the Continuous PNAD survey – 2nd quarter of 2023. Most people graduating in 2021 were in this age group, which justifies the comparison Sources Microdata from the Higher Education Census, INEP/MEC; Continuous PNAD, IBGE. Processed by the FAPESP Studies and Indicators Team Prepared by the FAPESP Studies and Indicators Team
Republish