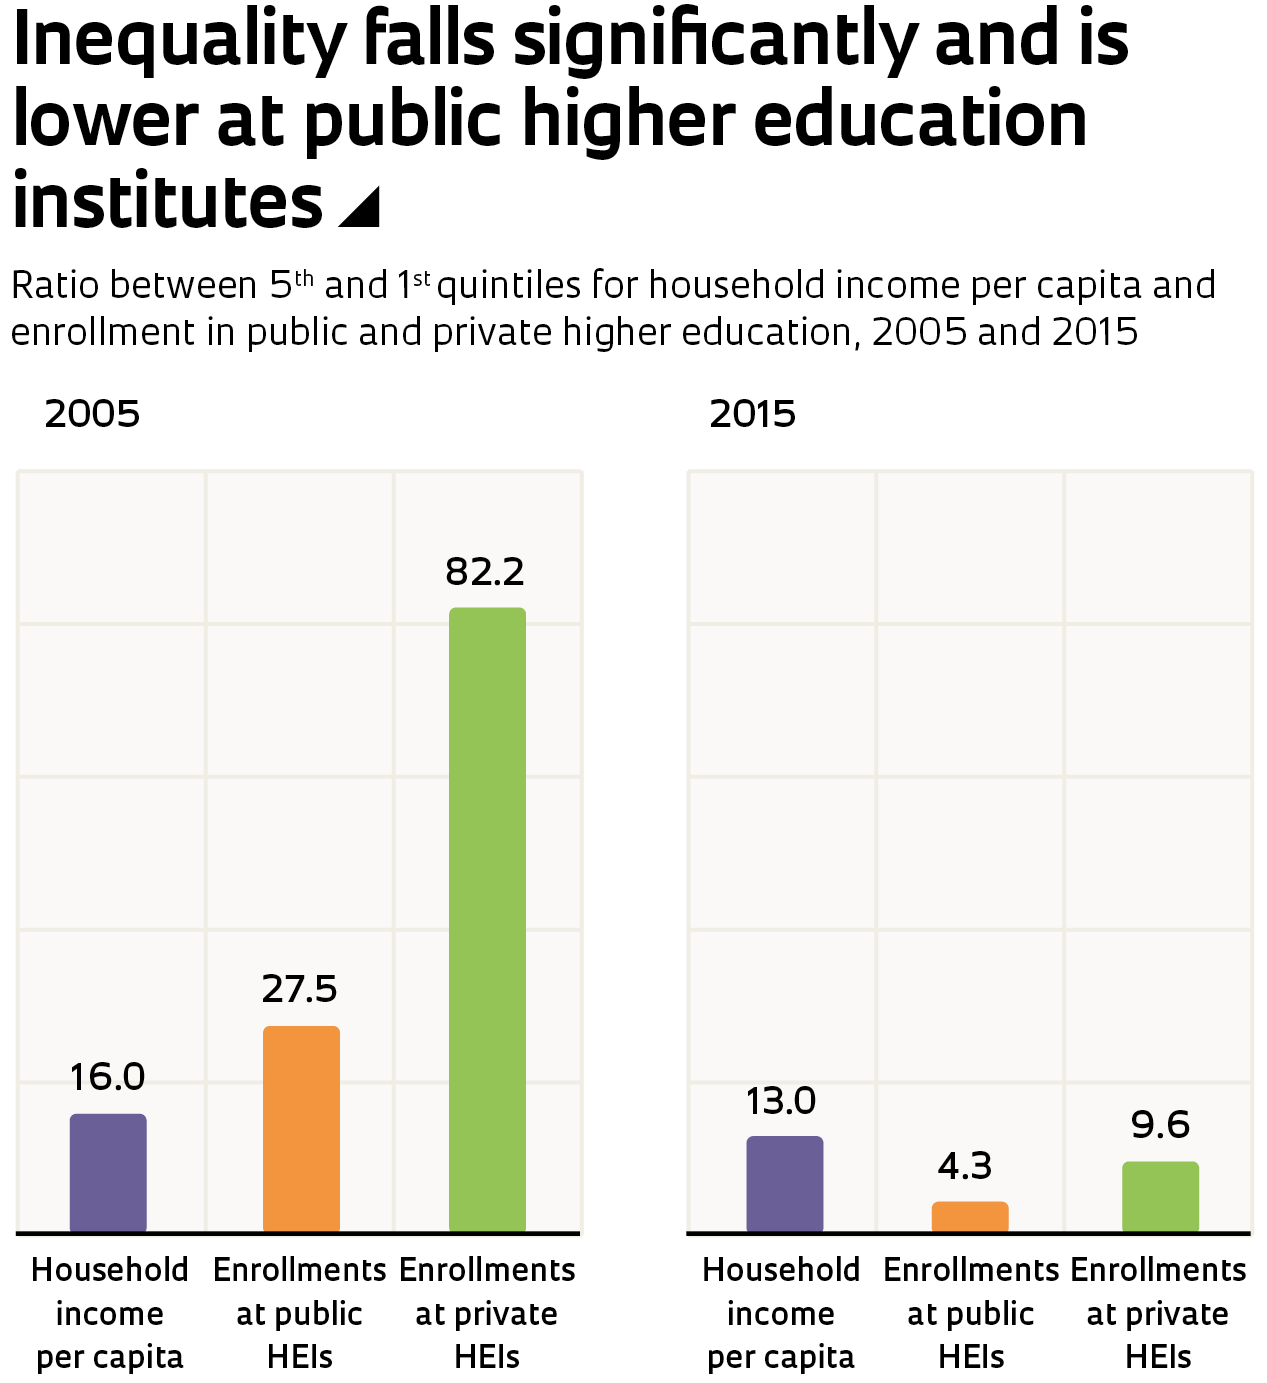
- Enrollments at higher education institutions (HEIs) by funding source and average monthly household income per capita, divided into quintiles, for private households in 2005 and 2015
- Between 2005 and 2015, the number of enrollments in higher education in Brazil grew from 4.57 to 8.03 million: an increase of 76%
- Students from families in the bottom two quintiles rose from 197,000 in 2005 to over 1.3 million in 2015, an almost seven-fold increase, and those from the bottom quintile alone increased by a factor of eight
- At the other end of the income scale, enrollments among the top two quintiles grew by 35% and by just 7% for the highest income group
- The figures show a reduction in the number of students enrolled in higher education from higher-income households per capita (4th and 5th quintiles) and an increase from the lowest-income households (1st and 2nd quintiles), at both public and private institutions

- One way of measuring income inequality is by determining the ratio between the highest and lowest income quintiles, called the “quintile ratio”3. The lower this ratio, the more equally income is distributed
- The data from the table above indicates that public HEIs had lower quintile ratios in both 2005 and 2015 than private HEIs
- The 2015 values show a significant reduction of this ratio compared to the 2005 values at both public and private HEIs, in a period during which the higher education system expanded rapidly
- The ratio of 4.3 in 2015 indicates low inequality in access to public higher education. With respect to income, this figure is typical of the Nordic countries, among the lowest in the world3
NOTES (1) CORRECTED BY THE BRAZILIAN NCPI OF SEPTEMBER 2015, CONTAINED IN THE ORIGINAL IBGE TABLE (PNAD, INCOME 2015, TAB. 7.6). (2) FOR AVERAGE HOUSEHOLD INCOME PER CAPITA, THE TOTAL VALUES ARE THE AVERAGES FOR ALL HOUSEHOLDS TOGETHER. (3) “QUINTILE RATIO”. HUMAN DEVELOPMENT INDICES AND INDICATORS 2018 STATISTICAL UPDATE, UNITED NATIONS DEVELOPMENT PROGRAMME, TABLE 3 – HTTP://HDR.UNDP.ORG/SITES/DEFAULT/FILES/2018_HUMAN_DEVELOPMENT_STATISTICAL_UPDATE.PDF.
SOURCES SUMMARIES OF HIGHER EDUCATION CENSUS, 2005 AND 2015, INEP/MEC. SOCIAL INDICATORS SUMMARY 2016, TAB. 4.6, IBGE. PNAD 2015, INCOME TAB. 7.6, IBGE. PREPARED BY THE BY THE ST&I INDICATORS TEAM FROM THE FAPESP STUDIES AND INDICATORS DEPARTMENT.
Republish