 The landscape of science, technology and innovation in the state of São Paulo has undergone changes in recent years, with the expansion, for example, of the efforts of many companies in research and development (R & D). In 2008 the private sector employed 53% of all active researchers in the state of São Paulo, up from 45% in 1995. The contribution of São Paulo to global scientific production also rose, from 0.82% in 2002 to 0.94% in 2006, the result of a 41.4% increase in the number of scientific papers published in indexed journals during that period. The illiteracy rate fell from 6.6% to 5% in the state between 1998 and 2006, although the indices that measure the quality of basic education changed very little. For university graduates there have never been so many job opportunities, especially in the private sector, where there is a shortage of candidates for vacant positions. The result is a better utilization of high school graduates by the universities, higher than many developed nations: 81% in São Paulo and 71% in Brazil, as well a rate of graduation from institutions of higher education in Brazil that is unexpectedly higher than countries like Argentina, Mexico and Chile, while the rate in São Paulo is even greater than that of Spain. Such indices are some of the highlights of the new edition of Indicators of science, technology and innovation in São Paulo – 2010, which FAPESP launches this month, a detailed analysis of advances in R & D in the state of São Paulo in recent years.
Consisting of 12 chapters the work is nearly 900 pages in length. It is the third time that FAPESP has launched Indicators, a program that responds to one of the goals of the Foundation that is “to conduct regular studies on the general state of research in São Paulo and in Brazil, identifying the fields of inquiry that should receive priority for development” as stated in its statutes. “It is in this context that these Indicators are published, constituting a very useful instrument to formulate and evaluate public policies relating to science and technology research,” wrote FAPESP President, Celso Lafer, in the introduction to the work. “A team of 69 experts, including coordinators, researchers and research assistants, did an exceptional job, carefully collecting and compiling data from often heterogeneous sources, and realizing an analyticaly detailed and precise work,” says the Scientific Director of FAPESP, Carlos Henrique de Brito Cruz. “Each chapter was read and criticized by 36 technical advisors and discussed in successive versions with the executive coordination team, led by Professor Wilson Suzigan” he adds.
 Calculations made by the researchers show, in Chapter 3, that the total expenditure on R&D in São Paulo reached R$15.5 billion in 2008, which is equivalent to 1.52% of the state GDP. This percentage is higher than countries like Spain, Portugal, Italy, Ireland, China, India, and all Latin American countries, but lower than in Canada, the United Kingdom, France, Taiwan, or the average of countries in the Organization for Economic Cooperation and Development (OECD), which is 2.3% of the regional GDP. Total spending in Brazil reached R$34.2 billion in 2008, which is 1.14% of the national GDP. The majority (63%) of investments in the state of São Paulo were made by the private sector. “This is another notable feature of the economy of the state, which is more industrialized than other states in the federation, having companies leading the effort to invest in R& D,” as stated in Chapter 3, written under the direction of Carlos Henrique de Brito Cruz and economists José Roberto Rodrigues Afonso, of BNDES, and Sinésio Pires Ferreira, of the Fundação Seade. The composition of spending on R&D in São Paulo is different from other states and the national average. Only 13% of such expenditure in São Paulo is of federal origin, while in other states, that proportion may reach as much as 53%. Expenditure by the state government in São Paulo has already reached 24%, compared to just 8.4% in all other states. Finally, spending by the private sector amounts to 63% of total spending in São Paulo, compared to 38% in other states. The trend is becoming more pronounced. Spending by businesses in São Paulo rose 37% in 2008 compared to 1995, in real terms (adjusted by the IGP-DI). In the same period, state government spending grew 47%, while that of the federal government increased by only 3%.
Indicator of change
The state of São Paulo had almost 63,000 researchers in 2008, 66% higher than 1995 estimate. One trend is the expansion of job opportunities in the private sector. Although institutions of higher education harbor a large part of the total number of active researchers in the state (42%), it was the number of researchers employed by private firms that grew most during that period (96%), going from 45% of the total in1995 (with 17,133 researchers) to 53% in 2008 (33,528). “The finding that companies themselves are expanding their contingent of researchers is, in and of itself, an indicator of important changes in corporate behavior, which, it seems, has begun to consider technological innovation as an important element of their competitive strategies and growth”, the text informs. Considering the number of researchers per million inhabitants, this figure is slightly higher for the state of São Paulo than that for China, Argentina, Mexico and with respect to Brazil as a whole, but is lower than in those nations with which the country must compete, such as Spain, Russia and South Korea. “A strategy for substantially growing the number of researchers in São Paulo in coming years is fundamental. (…) In the case of Brazil, the challenge is even greater,” it concludes.
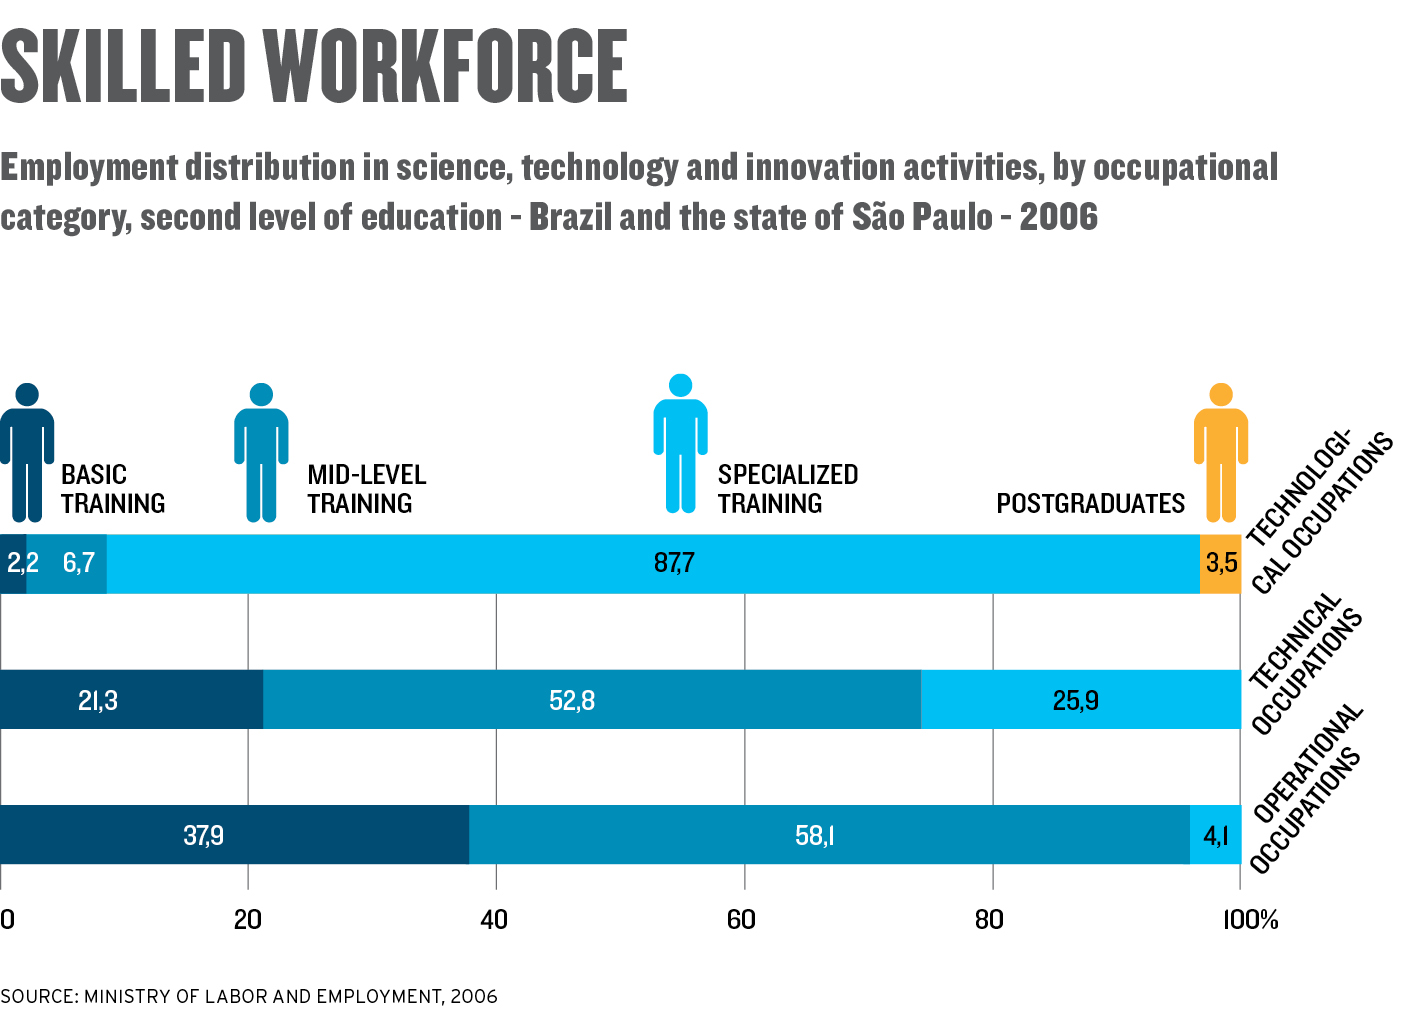
 In 2006, 28% of the 21.4 million Brazilians with a high degree of qualification were living in São Paulo. These numbers, while respectable, lose some of their shine when they are related to the economically active population: 20.4% for Brazil and 25.2% for São Paulo. In Spain, for example, that proportion reaches 37.6%. Interestingly, both in Brazil as a whole and in São Paulo, the number of people in occupations requiring highly qualified workers was much larger than the number of people with a university degree, which indicates that there is an educational deficit in the more qualified segment of the labor force. “At the same time, it was noted that a significant portion of those individuals with higher education are working in positions that require a lower level of skill than they acquired through their schooling. That is, we are faced with an apparent paradox: there are more and more people with a university degree, but at the same time there is a shortage of qualified professionals,” the study notes.
Highlights in the chapter on basic education, coordinated by the economist Vera Lúcia Cabral Costa, Director of the Teacher Training School at the Department of Education for São Paulo State (SEESP), include the consolidation of the poorest segment of the population in the state and national school systems and the persistence of low results in learning . In the past decade, enrollment in primary schools in the state of São Paulo has stabilized at around 6 million students. The schooling index of children from 7 to 14 years old reached 98.8% in São Paulo and 97.6% in Brazil in 2006. Among those who attend preschool (students from 5 to 6 years of age) was 90.8% in São Paulo and 84.6% in Brazil. The illiteracy rate in Brazil, which was 13.8% in 1998, fell to 10.4% in 2006. In the state of São Paulo, the illiteracy rate went from 6.6% to 5% during the same period.
Learning results in basic education have developed only a little, with improvement in the earliest grades of elementary school. At the fourth grade level, for example, the state of São Paulo had the third highest rate for the Index of Basic Education Development (IBED) in the country, increasing from 4.7 in 2005 to 4.9 in 2007. This progress is attributed to a combination of positive results in the pass rate and student performance in the assessments. Taken in an international context, however, this progress is not even perceptible. Since 2000, Brazil participated in one of the most important international assessments, PISA (Program for International Student Assessment) conducted by OECD. Assessments are conducted every three years and cover the areas of reading, math and science. In evaluations from 2000, 2003 and 2006, Brazil was placed last and in most years, Brazil even ranked below other Latin American countries such as Chile, Mexico and Uruguay. With respect to the other PISA participants, Brazil shows the greatest differences in performance between students from private and public schools, revealing a 30% performance gap in favor of private school students in all of the areas that were assessed.
 Evidence suggests that there is a major bottleneck with respect to university admissions. The number of spots available in public and private universities is now higher than the number of people finishing high school. This presents another paradox, which is addressed in the chapter on higher education, coordinated by anthropologist Eunice Durham, a professor at USP. On the one hand, the gross enrollment rate in higher education is still lower than all other Latin America countries. This rate, which expresses the relationship between total enrollment and the segment of the population that is between 18 and 24 years old, was 19.3% in Brazil and 24.4% in São Paulo in 2006. According to UNESCO, the gross enrollment rate in the same year was 92.6% in South Korea, 67.4% in Spain, 63.8% in Argentina, 46.6% in Chile, and 26.1% in Mexico. But on the other hand, Brazil has a very high percentage of enrollment by high school graduates in higher education, higher than many developed nations: 81% in São Paulo and 71% in Brazil. When looking at overall enrollment, it seems that total number of students in higher education in Brazil is much lower compared to other countries. But the picture is different when you consider the data on successful graduates of higher education with respect to the segment of the population aged 25 to 29. Brazil, with just over 20%, is ahead of Argentina, Chile and Mexico. And São Paulo, with a rate of more than 30%, beats Spain, which may only boast a rate of 28%, and is close to South Korea, with 39%. “One element that affects enrollment numbers is the system of access to higher education: some countries, like Brazil, make a selection of students at the end of high school. Other countries admit all high school graduates to higher education and in many cases, experience high rates of truancy and dropout,” according to the text.
Between 1999 and 2006, the gross enrollment rate in higher education in Brazil increased from 11.2% to 19.3%, representing a72% rate of growth. In São Paulo, the rates were even higher, going from 15.4% in 1999 to 24.4% in 2006, although the overall rate of increase was lower (58%) compared to the country as a whole. In Brazil, the number of high school graduates compared to the total number of places in institutions of higher education went from 1.72 per place in 1999 to 0.8 in 2006, with the number of opportunities exceeding the number of candidates. This excess of vacancies is primarily due to growth in the private sector, in which the relationship, which was 2.27 in 1999, dropped to 0.91 in 2006. In public institutions of higher education in São Paulo, there was a single place for every group of 14.2 high school graduates in 1999 and just 8.54 in 2006.
 Chances
The federal government’s limited support of publicly funded institutions of higher education in the state of São Paulo is highlighted. While a high school graduate in Acre has 70% chance of being admitted to a federal university, someone with the same basic schooling living in São Paulo has only a 1% chance to attend a federal institution of higher education. Throughout the country, in 2006 the federal government accounted for 12.2% of total enrollment and was the largest provider of higher education. Considering São Paulo alone, federal institutions accounted for only 0.7% of total enrollment, while the state accounted for 7.8%, almost 12 times more than that of the Union. “It’s perfectly legitimate for the Union to adopt policies that will help reduce regional inequalities,” the text states. “More than legitimate, such policies are necessary for the development of Brazil. At the same time, it is necessary that educational policy for the federal sectors of higher education population takes care not to abandon sectors of the population that obtained the necessary academic credentials and pay a significant portion of federal taxes.”
“In graduate school, one of the problems is saturation of the capacity at state institutions, such as USP and Unicamp, to increase the number of students.. In 2008, 2,265 students graduated from USP with doctoral degrees. As it employs 5,400 professors, the relationship between doctoral students and teachers is 0.42. At Unicamp this coefficient is 0.43, with 748 doctoral degrees awarded in 2008 and 1,743 professors on the faculty. In American universities, the rate is lower. At Stanford Univeristy and the Massachusetts Institute of Technology, the relationship is 0.34. At the University of California, Berkeley, it is 0.40. The chapter declares that expanding the capacity for training PhD students in São Paulo depends primarily on private and federal institutions.
The noted series of Technological Innovation Research (Pintec), done every three years by the Brazilian Institute of Geography and Statistics, confirms the chapter on the state of innovation in São Paulo, produced under the direction of economist André Tosi Furtado, a professor at Unicamp. Analysis of the data shows that multinational companies were responsible for more than 44% of industrial R&D in Brazil in 2005, one of the highest proportions in the world. This percentage was even higher in São Paulo, where it exceeded 56%. Furtado suggests that most industrial companies maintain a relatively passive posture, giving restricted importance to the adoption of innovations. “Few companies establish cooperative links with other firms or with universities and research institutes,” he says. The acquisition of machinery is still where the principal innovative efforts of Brazilian companies lie, unlike companies in European countries, where these resources are focused on internal R&D with the potential to create original innovations.
 An indicator that illustrates the structural weaknesses in Brazilian industry is the intensity of internal R&D, measured as the ratio of expenditure on internal R&D to value added. This rate was 1.5% in 2005 for the whole of industry in Brazil and 2.1% for the state of São Paulo, well below the 7.7% average of OECD countries. A comparison of the magnitude of R&D in various areas of industry shows that in high-tech sectors, the differences are even more pronounced in developed countries. The exception is the airline industry, where the intensity of R&D in Brazil is comparable to the other countries in that block. The automobile industry is responsible for nearly a quarter of industrial R&D in Brazil and more than 30% of the indicator in São Paulo. Almost half of Brazil’s industrial research focuses on three sectors: automotive vehicle production, coke, petroleum, and alcohol refining, and the manufacturing of aircraft. Five Brazilian companies appear in the UK Department for Business, Innovation, and Skills (BIS) 2008 ranking of companies that invest most heavily in R&D: Petrobras, Vale, Embraer, Braskem and WEG. The last two were not included in 2007 ranking. Among the four BRIC countries, Brazil surpassed only Russia, with three companies appearing in the ranking, while India had 15 and China had 9 companies on the list.
One area where little has changed is in patents. Brazil’s position in the ranking of the number of patents filed with the United States Patent and Trademark Office (USPTO) has remained at the same level for three decades. In 1974, Brazil was in the 28th position. In 1982 Brazil occupied the 25th position of the ranking, slipped to 27th place in 1990 and then fell to the 29th position by 1998, where it still remained in 2006. In absolute numbers, 44 patents where the first inventor was a resident of Brazil were filed in 1974, and went up to 341 in 2006. Chapter 5 of Indicators, coordinated by Eduardo da Motta e Albuquerque, a professor of economics at the Federal University of Minas Gerais (UFMG), it is observed that the stability of Brazil in recent years demands an effort by the country that should not be overlooked, since countries like Russia, Mexico and South Africa have lost their positions during this period. But he emphasizes that the mere maintenance of its world ranking in patents “should not be a goal of public policy in a country that still has not overcome the historical barrier of underdevelopment.” The leadership of São Paulo with respect to the number of patents registered with the National Institute of Industrial Property (INPI) remained stable in the period of 1980-2005, with 49.5% of the total for Brazil. During this period, Petrobras registered the highest number of patents with 804, followed by Unicamp with 408. In the 1990’s, the burden of increasing efforts to protect intellectual property rights by teaching and research institutions increased substantially- USP, UFMG and the Institute for Technological Research (IPT) also appear among the leaders in patent registration. This reveals the immaturity of the system of innovation in Brazil – in developed countries, patents are obtained mostly by companies, not public universities. “Unfortunately, the role of teaching and research institutions in acquiring patents is magnified by the timidity of the private sector in seeking patents. (…) The timidity should serve as a reminder of the need for more daring industrial and technology policies, given the need for the significant expansion of companies involved with innovative activities,” affirms the study.
 The balance of technological payments, which portray trade relations involving supplies and technological products, is the subject of a chapter coordinated by economist João Furtado, a professor at Poli-USP. The highlight in this field is the increase in exports of medium-technology products ($37.3 billion in 2002 and 2005) compared to imports ($10.6 billion). These figures indicate the importance of this technology category, which includes agricultural commodities and agribusiness, to the overall increase in exports from Brazil in recent years. The study points out, however, that the success in commodities exported from Brazil depends on, rather than preaches, the common sense of having a strong connection to technological development, as in the case of offshore oil extraction and various agricultural products – improvements in sugarcane production is one of several examples. “The agricultural industry in Brazil produces and exports products that are classified as commodities (invariably associated with low technology), but that does not to say that they do not incorporate or mobilize certain technologies, knowledge and science. In fact, this scientific and technological content has ancient origins that are both local and external,” wrote Furtado, who is the Coordinator of Technological Innovation at FAPESP. While exports from other states are concentrated in agricultural products, agribusiness, minerals and energy, São Paulo plays a significant role in the sale of high technology products overseas. A prime example is Embraer. According to Furtado, this shows that you can produce high-tech items competitively, even when it’s necessary to import the required components. “Embraer, the most often cited example of the high tech industry in Brazil, exports aircraft that it designs and manufactures, using components, parts, modules and systems that are imported. Its exports in 2007 reached $ 4.7 billion and well exceeded its total cost of imports, which was $2.9 billion.”
Jobs in technology
The chapter on the regional dimension of R&D activities in the state of São Paulo shows a concentration of occupations in technology (80.7% of total) and technical occupations (74.8%) in 10 micro-regions: the capital city (São Paulo), Campinas, Osasco, São José dos Campos, Sorocaba, Guarulhos, Santos, Ribeirão Preto, Mogi das Cruzes and Itapecerica da Serra. The metropolitan region of São Paulo has relatively reduced participation in the so-called operational occupations, which is indicative of the increased transfer of factories to the interior of the state and other parts of the country, while focusing more on research laboratories and the overall structures of business management. Regional data for Pintec shows that the metropolitan area accounts for more than 50% of the innovative companies in the state and nearly 20% of those in all of Brazil. Mapping reveals two other phenomena. One is the importance of some interior regions the state, such as Campinas and São Jose dos Campos, which are located relatively close to the São Paulo metropolitan area and are very active in R&D, with the presence of innovative local companies and good universities. The other phenomenon is related to regions of the interior of São Paulo with less expressive R&D indicators. By comparing the most recent data with that of previous editions of Indicators, we can see that there was an increase in the qualifications of the workforce and the number of institutions training the workforce in technological, technical and industrial skills. “This development can create opportunities for the creation and dissemination of new knowledge in supporting innovative processes by companies,” this chapter relates, coordinated by Renato de Castro Garcia, a professor at Poli-USP.
 The contribution of São Paulo to global scientific production increased from 0.81% in 2002 to 0.94% in 2006. The state was responsible for 51% of the production from Brazilian, as indexed between 2002 and 2006, a level slightly higher than that of the 1998-2002 period, which was 49.9%. This growth is associated with a 41.4% increase in scientific production in São Paulo from 2002 to 2006, chapter 4 shows, which examines scientific production in the context of publications in specialized journals, coordinated by Leandro Innocentini Lopes de Faria, a professor in the Department of Information Science at the Federal University of São Carlos (UFSCar). Brazil’s contribution to the global production index increased from 1.6% in 2002 to 1.9% in 2006. The 43.5% increase in the number of journal publications by researchers in Brazil during this period was higher than the worldwide growth rate of 22.7%. Institutions with the highest production indices in the country between 2002 and 2006 were the USP, with 25.5% of all publications from Brazil, Unicamp with 10.1%, the Federal Univeristy of Rio de Janeiro (UFRJ) with 8.7%, the State University of São Paulo (UNESP) with 7.3%, the Federal University of Rio Grande do Sul (UFRGS) with 5.8%, UFMG with 5.2%, the Federal University of São Paulo (UNIFESP) with 4%, Fiocruz with 3.1%, and UFSCar with 3%.
International scientific collaboration by Brazilian researchers grew 30.4%, during this period, when you count publications co-authored with foreigners, but contributed to a decline in the total number of publications by nationals alone, from 33.1% in 2002 to 30% in 2006. The collaboration between researchers based in different states in Brazil grew by 79.4% during this period. Although the number of citations of strictly national studies is still relatively small, there was a significant increase between 1990 and 2003, from 0.16% to 0.55% of the total number of indexed citations in the world. In the group of countries with scientific production rates between 2% and 5% of the world total, publications from Canada showed a high, but decreasing level of citations from 1990 to 2003 (from 4.2% to 3.7%). Publications from Spain, Australia and India had increased rates of citation, as did South Korea, which in 1990 experienced a citation rate well below that of Brazil (0.06% versus 0.16%), but by 2003 the value had reached 0.94%, almost double the value for Brazil in that year.
 The last chapter of Indicators presents the results of a survey on public perceptions of science and technology in the state of São Paulo, coordinated by the linguist Carlos Vogt, who was the President of FAPESP in 2002 and 2007. The survey shows that the level of interest declared by residents of São Paulo on topics in science and technology is not low and is comparable, at least for the capital city, to many European countries. But there is a big challenge, related to social inequality and access to education, still to overcome. From an economic standpoint, those who expressed no interest whatsoever in science and technology tend to belong to classes C and D, while those who said they were very interested science and technology represent a significant fraction of individuals belonging to classes A and B.
One novel finding is that the dissemination of science and technology data in São Paulo and organized by FAPESP will increase. “Beginning in the second half of 2011, FAPESP will monitor the indicators of expenditure, staff, publications and patents more frequently, including the publication of a monthly newsletter outlining the points of greatest impact for R&D strategies in São Paulo. Furthermore, a synopsis of the data will also be published each year,” says Carlos Henrique de Brito Cruz.
Republish