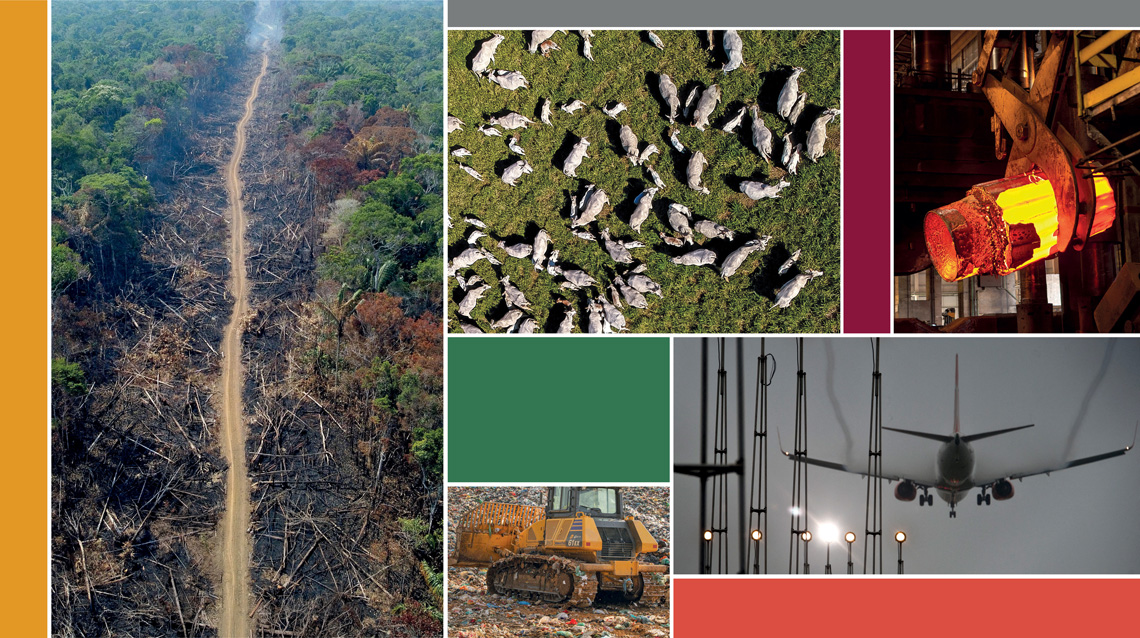
The two sectors account for 70% of the country’s greenhouse gases emissions
Michael Dantas/AFP via Getty Images | Alfribeiro/Getty Images | Nelson Almeida/AFP via Getty Images | Leila Melhado/Getty Images | Tony Oliveira/Agência Brasília
Wherever deforestation advances and agriculture spreads across Brazil’s heartland, greenhouse gas (GHG) emissions follow closely. The country has a very different profile to the major economies that emit the most carbon dioxide (CO2₂), methane (CH₄), nitrous oxide (N₂O), and fluorinated gases (such as HFCs, PFCs, SF₆ and NF₃), which represent almost all the GHGs produced on the planet. These compounds trap heat in Earth’s atmosphere, causing global warming and driving climate change.
According to the most recent National Inventory of GHG Emissions and Removals, published by Brazil’s Ministry of Science, Technology, and Innovation (MCTI) in December 2024, 39.5% of the GHGs emitted by Brazil come from the conversion of native vegetation—primarily rainforest—into fields, pasture, and farmland. Another 30.5% comes from agriculture, especially cattle farming (almost 20% of the total) and soil management (7%).
The document also shows that the energy sector, which accounts for emissions from fossil fuels (oil, gas, and coal) is responsible for 20.5% of emissions. The two major categories that emit the least GHGs are industry (5% of the total) and solid and liquid waste disposal and treatment (4.5%). The percentages are for 2022, the last year covered by the inventory’s historical data.
Land use, land-use change, and forestry (LULUCF)—which includes emissions from deforestation—together with agriculture, carries a weight in Brazil’s carbon balance rarely seen in countries of similar size. In Indonesia, which is home to the second largest tropical forest on the planet and whose economy is almost two-thirds the size of Brazil’s, the energy sector accounts for 53% of emissions (with agriculture at almost 10% of the total and LULUCF just over 22%). Among the world’s largest greenhouse gas emitters, the energy sector is responsible for approximately 75% of emissions, proportionally almost four times more than Brazil.
“The rate of deforestation in the Amazon has a major influence on the profile and scale of Brazil’s emissions,” says economist Régis Rathmann, supervisor of the national inventory. Deforestation greatly influences upward or downward trends in national emissions. “Because our energy mix is so clean due to the use of biofuels for vehicles and hydroelectric plants and other renewable sources for electricity, emissions from the energy sector play a proportionally lower role here than in other countries.”
Alexandre Affonso / Pesquisa FAPESP
Brazil’s contribution to total global emissions varies depending on the year and the analysis methodology. The country almost always appears in sixth place on the list of greatest GHG generators, sometimes rising to fifth or falling to seventh. Its output represents between 2% and 3% of global greenhouse gas emissions recorded in a given period. According to the Emissions Gap Report, released last year by the United Nations Environment Programme (UNEP), Brazil was the sixth largest GHG emitter in 2023, behind China (30% of the total), the USA (11%), India (8%), the European Union (6%), and Russia (5%).
Brazil’s net GHG emissions in 2022 reached just over 2 billion tons (t) of carbon dioxide equivalent (CO2eq), a slight decrease from the previous year. Net emissions represent all GHGs generated by all sectors of the economy (gross emissions) minus the removal of atmospheric CO2 through carbon fixation, via photosynthesis for example, in the biomass of vegetation in conservation units and indigenous reserves.
Alexandre Affonso / Pesquisa FAPESP
To be able to calculate a single value for the sum of all emissions of the main GHGs, national inventories adopt CO2eq as the unit of measurement. The Intergovernmental Panel on Climate Change (IPCC) recommends using the GWP100 index to calculate the equivalence between the gases. The metric is used to transform the emitted amount of methane, nitrous oxide, and fluorinated gases into their carbon dioxide equivalent.
“The conversion is based on the half-life and the potential of each gas to warm the atmosphere over a period of 100 years, compared to CO2₂,” explains chemical engineer David Tsai, from the nongovernmental organization Energy and Environment Institute (IEMA). Tsai is head of the Greenhouse Gas Emissions and Removals Estimation System (SEEG), a project run by the Climate Observatory (OC), a network of nongovernmental organizations. A civil society initiative formed to calculate the country’s carbon balance, SEEG adopts a similar methodology to the national inventory. Brazil’s total net emissions according to the national inventory and SEEG tend to be very similar, reflecting the same upward or downward trends in GHG output.
For 2022, SEEG calculated total net emissions of almost 2 billion t of CO2eq, slightly lower than the figure determined by the national inventory. The most recent data from the system set up by the OC is from 2023, when net emissions were recorded at 1.65 billion t of CO2eq, a 15% drop from 2022. The national inventory has not yet released its emissions values for 2023. “We calculate emissions based on consolidated data, which take time to obtain from institutions that provide them. Furthermore, we comply with the international commitment to report emissions with an interval of up to two years between the inventory year and the submission year. It is the same standard adopted by developed countries,” says Rathmann. “This way, we have more consolidated official data on the sectors included in the inventory.” For SEEG, there is a little more freedom. When consolidated information on the national economy is not available, it can make use of alternative sources, or in extreme cases, even estimates.
The IPCC recipe In 2006, the IPCC laid the methodological foundations used by most countries and projects, including SEEG, to create inventories of their GHG emissions. “This methodology is periodically updated as science advances and the way of calculating emissions from each economic activity or process is refined,” explains agricultural engineer Carlos Eduardo Cerri of the Luiz de Queiroz College of Agriculture at the University of São Paulo (ESALQ-USP), head of the Center for Carbon Studies in Tropical Agriculture (CCarbon-USP), one of the Research, Innovation, and Dissemination Centers (RIDCs) funded by FAPESP. “It is important that countries adopt the same criteria so that their emission levels can be properly compared.”
The first step for the inventories is to calculate emissions in five sectors: energy; industrial processes and product use; agriculture; waste; and LULUCF. The first four only emit GHGs. However, LULUCF is the only one that in addition to emitting the gases can also remove CO2 from the air through photosynthesis, which fixes carbon in plant biomass and even in the soil.
Then, the volume of GHGs generated by each process or activity within these sectors is calculated. Two types of information, known as activity data, which are multiplied by emission factors, are essential to this calculation. Activity data demonstrates the scale and main characteristics of an economic sector. In the industrial processes and product use sector, an example would be the number of tons of cement or iron produced per year. Emission factors are values established in scientific literature that estimate how much GHG each activity releases. They are divided into three tiers.
The first tier, proposed by the IPCC, is the most generic and least precise. It is an emission factor that applies to a certain activity, regardless of the conditions and the country in which it occurs. The second applies to a nation or parts of it. Tier 3 is more precise and has the potential to cover emissions from a specific location or factory. “Brazil uses tier 2 and 3 emission factors to estimate 95% of its total emissions, like the most developed countries,” says Rathmann.
Alexandre Affonso / Pesquisa FAPESP
A case that illustrates this particularity well is the calculation of methane produced by enteric fermentation (the digestive process) in ruminants, essentially cattle, of which there are more than 200 million in Brazil, accounting for almost a fifth of all GHGs generated by the country. There are specific emission factors for different types of cattle raised in each Brazilian state. In the SEEG report, for example, a free-roaming male bovine aged over 2 years old is considered to emit 72 kilograms (kg) of methane per year if raised in Mato Grosso, Mato Grosso do Sul, or Goiás, and 63 kg/year if raised in Alagoas or other states.
These differences impact the outcome of the inventory. “We need to do more science to propose more specific emission factors,” says Gabriel Quintana, an environmental engineer from the Forest and Agricultural Management and Certification Institute (IMAFLORA) who coordinates SEEG’s work in the agricultural sector. To be accepted internationally, tier 2 and 3 impact factors must be transparently documented, follow IPCC guidelines, and have a robust scientific or empirical basis.
Between 1990 and 2022, annual methane production per head of beef cattle fell by around 8% in Brazil, according to the national inventory. However, because the total number of cattle grew at a faster rate than methane generation fell, total emissions by enteric fermentation continue to rise. “Improving pasture quality reduces methane production by cattle,” Cerri points out. “We still have a lot of room for improvement in this area.”
Alexandre Affonso / Pesquisa FAPESP
The weight of deforestation Emissions related to land use, land-use change, and forestry is calculated differently to other sectors. Greenhouse gases are released when a land-use type that stores more carbon, such as native forests, is converted into one that retains less, such as fields, pasture, and agriculture. In other words, the emission is a result of deforestation. This is the “economic activity” recorded by the LULUCF sector. Emissions are calculated as the difference between the amount of carbon that was stored in the native forest area and the amount retained by the area in its new status after the original vegetation was removed.
These values can differ greatly, especially when they involve the Amazon rainforest, which stores more carbon in plant biomass than the vegetation of other ecosystems. Both SEEG and the national inventory use specific tier 2 emission factors for different plant physiognomies in the Amazon. There are 44 plant physiognomies in the biome, which covers half of Brazil’s national territory. The most common belongs to the dense ombrophilous forests group, which covers about half of the Amazon.
The amount of carbon stored in one hectare of this type of forest ranges from 130 t to 201 t. “One hectare of pasture stores an average of around 10 tons, and one hectare of soybeans stores about 6 tons,” says Bárbara Zimbres, an ecologist from the Amazon Environmental Research Institute (IPAM) who leads LULUCF monitoring at SEEG. As a conservative estimate, the transformation of one hectare of rainforest storing 130 tons of carbon into pasture will result in an emission of 120 tons of GHGs. The national inventory uses land use and land cover data from satellite images of Brazilian territory, in addition to other data, while SEEG uses maps from the MapBiomas project, another initiative started at the Climate Observatory, which now involves research institutions, nongovernmental organizations, and technology and geoprocessing companies.
The LULUCF sector is the only one that also accounts for the removal of carbon from the atmosphere; the others only contribute to the (majority of) emissions in an inventory. This means that the net emissions value from the sector could be lowered by adopting practices that absorb CO2 from the atmosphere or prevent it from returning to the air.
Two carbon removal mechanisms are accepted by the IPCC and accounted for in carbon inventories. The most important is linked to plant growth. Through photosynthesis, they absorb CO2 and store carbon removed from the atmosphere in their trunks, branches, leaves, roots, and the soil. This mechanism occurs where there is developing vegetation.
However, in carbon inventories, only vegetation growth in protected areas (conservation units and indigenous lands) and secondary forests is counted as carbon removal. These represent plant formations that grow spontaneously in old areas of native forest that have been deforested and then abandoned. “Because efforts are made to maintain vegetation in protected areas, the carbon stored in plants in these areas can be counted as removal in the inventory,” explains Zimbres.
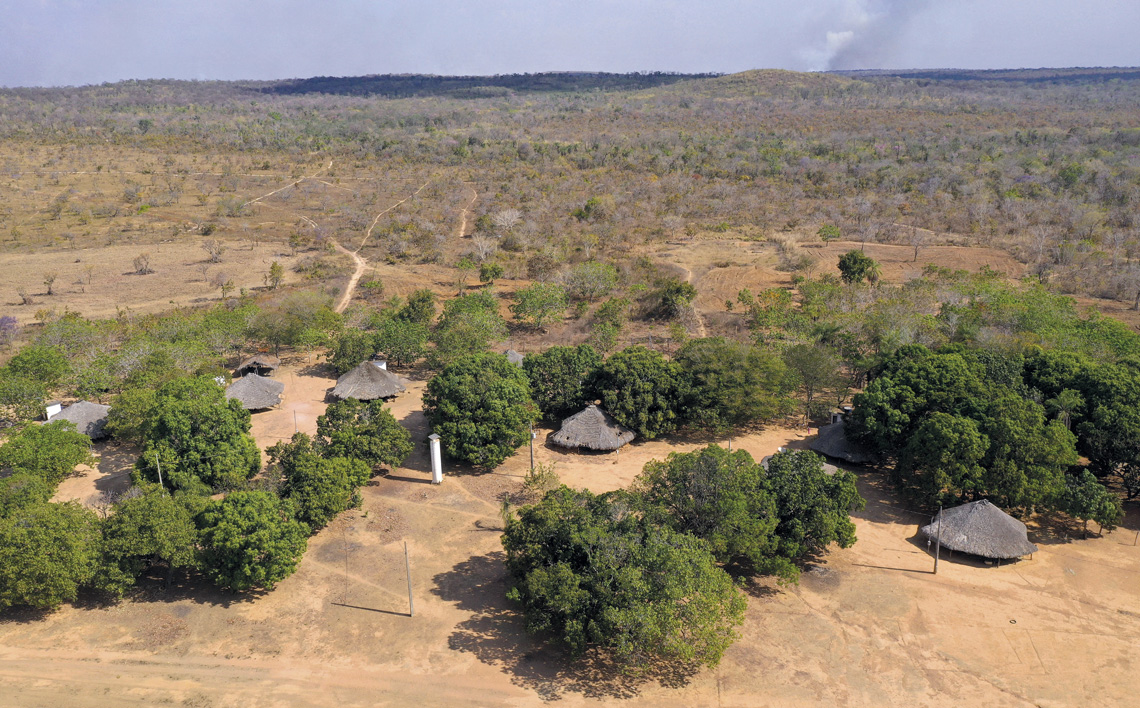
Fabio ColombiniCarbon fixed by flora in protected indigenous reserves is included in inventories as removal of atmospheric CO2Fabio Colombini
The second situation that can be included as carbon removals is the use of wood from reforested areas, such as eucalyptus plantations, to manufacture furniture or other goods. Since this wood is not burned and will not be left to rot outdoors, its carbon stock does not return to the atmosphere. It remains fixed in the product for a long time, while the reforested area grows back and sequesters more carbon from the air, creating a virtuous cycle. In 2022, the inventory calculated that removals in protected areas and managed reforestation zones reduced the final value of Brazil’s total GHG emissions by 15.3% and 2.8% respectively. These data demonstrate the environmental importance of protecting large areas of the national territory.
As rigorous as they are, carbon inventories are not perfect, although they do improve with each edition. Even so, there are gaps and inaccuracies in terms of GHG emissions and removals. The margin of error in the national inventory’s calculations is around 20%. It is similar in SEEG’s report. The methodology recommended by the IPCC is periodically refined to improve how greenhouse gas production is calculated for different sectors of the economy.
In Brazil, one inconsistency is the national inventory’s failure to include emissions produced by fires not associated with deforestation. Fires directly linked to deforestation are included in the official calculations. However, it is still a challenge to adequately record large-scale fires in fields, pasture, or forests, whether intentional or not, in inventory estimates. “With recurring droughts in the Amazon and other regions of the country, in addition to warmer temperatures, these fires have become more intense, frequent, and significant in terms of carbon emissions,” says agricultural engineer Jean Ometto of INPE, one of the coordinators of the FAPESP Research Program on Global Climate Change (PFPMCG). “Recurrent fires tend to degrade the forest, affecting its ability to sequester carbon from the atmosphere.”
The emission of GHGs from fires not related to deforestation is included in SEEG’s annual report, however. But this source of greenhouse gas production is presented separately from the rest, since the emissions are not accounted for in the inventory. In 2023, SEEG recorded a figure of 100 million t of CO2eq.
The nearly 200 signatories of the United Nations Framework Convention on Climate Change (UNFCCC) and the Paris Agreement—an international treaty signed in 2015 that seeks to curb GHG emissions and thus limit global warming to a maximum of 2 degrees Celsius—must periodically report their total emissions. In addition to supporting the formulation of national policies, the inventories serve as a basis for countries to establish their own targets for reducing future emissions, known as nationally determined contributions (NDCs), within the scope of the Paris Agreement.
Brazil’s latest target, set last year, is to reduce net GHG emissions (which considers removals made through vegetation maintenance) to between 59% and 67% of 2005 levels by 2035. This would put Brazil’s emissions at between 850 million and 1.05 billion tons of CO2eq per year. Since the end of 2024, the countries that signed the Paris Agreement have been required to produce official inventories every two years, using a standardized methodology for the reports. “This will make it easier to compare emissions across countries, especially among those that previously used older methodologies,” says Rathmann. It is getting harder and harder for nations to hide their carbon footprint.
The story above was published with the title “Rhythm of the forest and the field” in issue 353 of July/2025.
This article may be republished online under the CC-BY-NC-ND Creative Commons license. The Pesquisa FAPESP Digital Content Republishing Policy, specified here, must be followed. In summary, the text must not be edited and the author(s) and source (Pesquisa FAPESP) must be credited. Using the HTML button will ensure that these standards are followed. If reproducing only the text, please consult the Digital Republishing Policy.