On November 9, the Brazilian government released data eagerly awaited by the Brazilian public and the international community: the 36th official annual deforestation rate in the Legal Amazon, an area of approximately 5 million square kilometers (km²) that corresponds to 58.9% of the national territory of Brazil. The released figures were encouraging.
According to an estimate from the Brazilian Amazon Deforestation Satellite Monitoring Program (PRODES), run by the Brazilian National Institute for Space Research (INPE), the deforestation area between August 2022 and July of this year reached 9,001 km², 22.3% lower than that in the previous year. The rate remained above 10,000 km² per year between 2019 and 2022.
Created in 1988, PRODES is the first and oldest initiative to use satellite imaging to monitor deforestation in the Brazilian Amazon, home to the largest tropical forest on the planet. The data collected by the program, recognized in international agreements and cited in almost 1,600 scientific articles, indicate that approximately one-fifth of the rainforest has been deforested in recent decades.
In 2004, the Real-Time Deforestation Detection System (DETER) of the INPE began operating alongside PRODES, issuing daily alerts on parts of the rainforest where vegetation loss occurs. These daily notices are intended for environmental agencies, which use this information to counter deforestation.
“Brazil is renowned for its remote sensing, an area in which we do First World work,” said engineer and geoprocessing specialist Gilberto Câmara, who was the general director of the INPE between 2006 and 2013 and now works as a consultant in the sector. “In the 1970s, Brazil was the third country in the world to use images from Landsat satellites, after the USA and Canada.”
After PRODES and DETER, projects led by public scientific organizations, such as MapBiomas and the Institute for Humans and the Environment in the Amazon (Imazon), began monitoring deforestation dynamics and progress in the Brazilian Amazon via satellite image analysis.
Although they share points in common with the pioneering initiatives of the INPE, each pursues slightly different objectives and employs specific methodologies to produce data. They may adopt different satellites, for example, with different spatial resolutions and revisit times for each point in the Amazon. They may also analyze images automatically, using software alone, or together with the trained eye of a specialist. They all, however, publish calculations of the monthly or annual deforestation in the Amazon.Due to these characteristics, the results often do not coincide 100% with the information provided by PRODES and DETER. Experts do not consider these differences a concern, as long as the general overview portrayed by each initiative points to similar trends, such as an increase or reduction in deforestation.
“The public system for monitoring deforestation in the Amazon is good and reasonably robust,” said physicist Ricardo Galvão, president of the Brazilian National Council for Scientific and Technological Development (CNPq). “Initiatives by civil society are welcome and do very important complementary work.” Brazil has made an international commitment to eliminating deforestation in the Amazon by 2030.
In August 2019, Galvão was dismissed from his position as INPE director after having publicly defended the accuracy and fairness of the institute’s data on deforestation in the Amazon against unfounded criticism made by then-president Jair Bolsonaro and his ministers.
At the time, the annual deforestation rate calculated by PRODES exceeded 10,000 km, which is a value that has not occurred since 2008. The federal government questioned the veracity of this number and threatened to hire a private company to do the work of the INPE. The incident received international news coverage, but the idea of outsourcing the monitoring process did not progress.
The availability of several systems dedicated to observing and calculating the suppression of native vegetation in the Amazon allows official data to be confirmed, refined, or even refuted by the public. If PRODES and DETER fail to operate for some reason, alternatives are available. “These alternative systems can also function as a backup of INPE’s services,” said Imazon remote sensing specialist Carlos Souza Jr.
To help better understand the similarities and differences between various systems, Pesquisa FAPESP summarized the main characteristics of five initiatives that monitor deforestation in the Amazon — four Brazilian and one from abroad.
Prodes
Remote sensing specialist Cláudio Almeida, head of INPE’s Monitoring Program for the Amazon and other Biomes, shared an interesting story regarding the projects that preceded and fostered the expertise needed to set up PRODES. In the 1970s, when official public policies aimed to encourage the occupation of the Amazon and the implementation of large agricultural projects, one of the federal government’s concerns was how to ensure that financial incentives were being used appropriately.

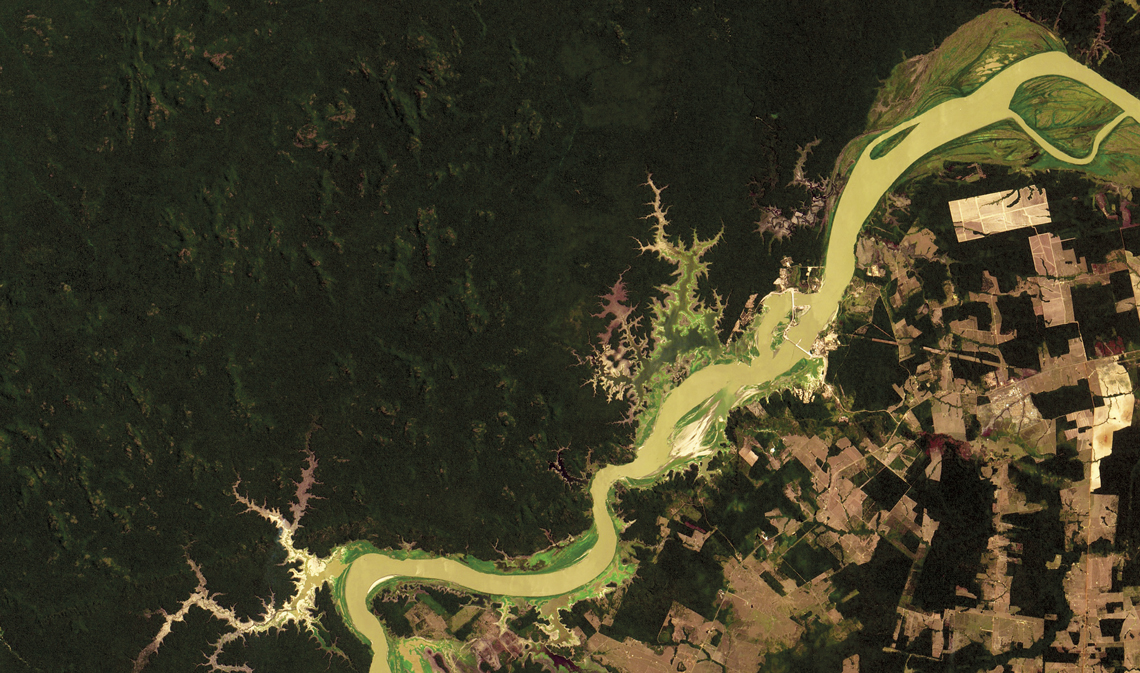
Cbers4 / Amazozia 1 / Landsat 9 / Sentinel 2 / INPEDeforestation patterns created by different activities (from left to right): burning, degraded area, forest clearing, and miningCbers4 / Amazozia 1 / Landsat 9 / Sentinel 2 / INPE
“It was then that monitoring the Amazon using satellite images was conceived of as a way of ensuring the projects were being correctly implemented, to verify that areas of the forest were being deforested to make room for agriculture and livestock,” said Almeida.
This notion of progress began to be notably questioned as the environmental movement grew in strength during the 1980s. As home to the largest tropical forest on the planet, Brazil has become internationally responsible for the Amazon, which fulfills an important role in regulating the global climate, in addition to its high biodiversity. Against this backdrop, contrary to the prevailing philosophy of the previous decade, PRODES was created in 1988 with a simple objective: to estimate the annual deforestation rate of native forests in the Legal Amazon. The Legal Amazon — a designation established in 1953 with the aim of stimulating economic development in a region that stretches across nine Brazilian states — covers the entire Amazon biome in Brazil, as well as 37% of the Cerrado (a wooded savanna) and 40% of the Pantanal.
The Amazon biome in Brazil, where the tropical forest is located, extends across an area of almost 4.2 million km², equivalent to 49% of the national territory. The difference between the Legal Amazon and the Amazon biome is approximately 800,000 km², more than 9% of Brazil’s land. “It is important not to compare deforestation data from the Legal Amazon with data from the Amazon biome,” emphasized Almeida.
One unique aspect of PRODES is that it follows the so-called deforestation calendar, based on the fact that deforestation occurs most intensely during the driest time of the year. The PRODES year thus begins in August, at the beginning of the dry season, and ends in July of the following year. Notably, the data for 2023 cover the period from August 2022 to July 2023.
The type of deforestation recorded by PRODES is clearcutting, which is the complete removal of forest cover from one year to the next. This is generally done to create space for agricultural activities or to establish urban areas or space for hydroelectric dams.
In 2022, PRODES began to measure deforestation occurring through the progressive clearing of vegetation. This process is slower, more difficult to detect by satellite, and can occur over a number of years. This type of deforestation is associated with selective logging and the use of fires.
Only deforested areas that reach a minimum of 6.25 hectares (ha) in size, equivalent to 62,500 square meters (m2) or just over six soccer fields, are included in the calculation of the annual deforestation rate. Critics have claimed that the minimum size is too large, resulting in much deforestation being overlooked.
“In the Amazon, deforestation is carried out to establish large properties, areas of soybean monoculture, or cattle farms. It is not worth clearing small areas, which is very costly and laborious,” explained Câmara, who does not consider the size of the area monitored by PRODES as a significant limitation. “The 6.25-ha area is enough to take most deforestation into account.” The PRODES system already monitors deforestation in areas as small as 1 ha (10,000 m2), but it does not include them in the calculation of the annual rate. It is likely that it will begin to do so soon.
The system uses images from five satellites: Landsat 8 and 9, launched by the North American Space Agency (NASA) and the United States Geological Survey (USGS); Sentinel, from the European Space Agency (ESA); and CBERS 4 and 4A, a joint project by Brazil and China.
Landsat images form the main database of the system. To monitor the entire Legal Amazon, 229 satellite images from the Landsat family are needed. Each image, also referred to as a scene, covers an immense area of 32,400 km², just over four times the size of the São Paulo Metropolitan Area.
If areas of the rainforest are covered by clouds when the Landsat satellites pass overhead, CBERS and Sentinel images can be used to fill any missing data points. On average, any given area is observed by a satellite used by PRODES every 16 days. In practice, the interval between two images can range from 5 to 26 days.
The smallest information point within a Landsat image is the equivalent of a square measuring 30 by 30 meters (m) (0.09 ha or 900 m2), which is slightly larger than two basketball courts. Remote sensing experts thus described the spatial resolution (one pixel) of a Landsat image as 30 m. The minimum area of deforestation accounted for by PRODES, at 6.25 ha, therefore comprises 69.4 pixels. The number of CBERS or Sentinel pixels is even smaller. The images produced by the Chinese-Brazilian satellites exhibit a spatial resolution of 20 m. The European hardware offers a spatial resolution of 10 m.
To calculate the annual deforestation rate, approximately 25 technicians at INPE headquarters in São José dos Campos manually compare the best available images of what an area looked like at the beginning and end of the current PRODES year.
These experts delimit the newly deforested areas directly on a computer screen, identifying forest cover changes based on elements visible in the images, such as tone, shape, texture, and context of the deforested areas. “Our workforce is made up of many CNPq grant recipients. We need more staff hired on a stable basis,” said Almeida.
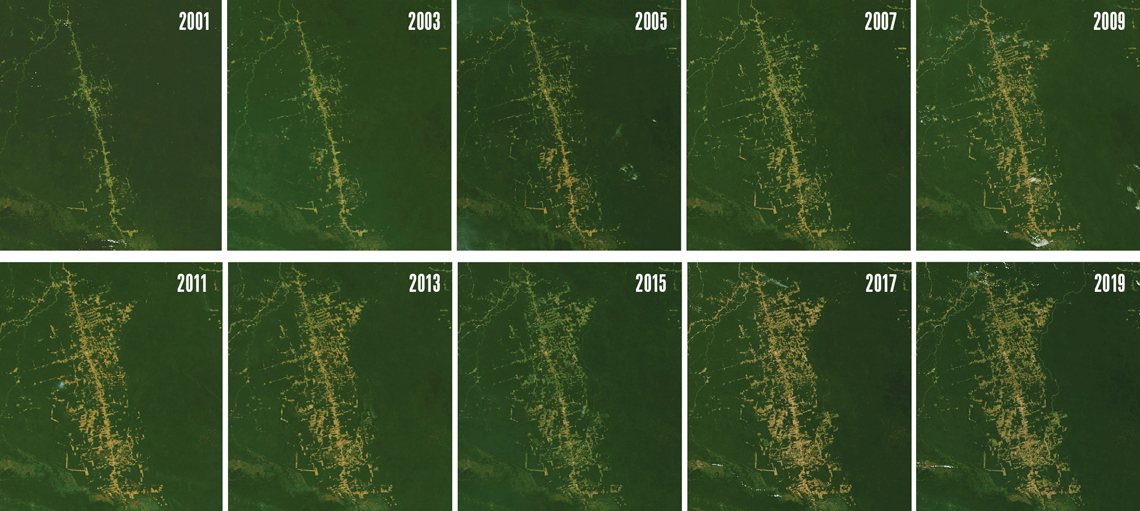
NASA / LandsatDeforestation in an area of the Brazilian Amazon over almost 20 yearsNASA / Landsat
DETER
Sixteen years after PRODES, when deforestation rates in the Legal Amazon were on the rise, DETER was conceived as a tool to help combat the problem in near-real time. DETER issues daily deforestation notices automatically sent to government bodies and state environmental departments responsible for stopping deforestation.
These notices are also shared publicly online, usually on Fridays, with a one-week delay. The system also publishes monthly and annual deforestation totals following the PRODES calendar year. Although the DETER numbers differ from the PRODES numbers due to methodological differences, they typically indicate the same deforestation trends.
The DETER methodology has improved and been refined over time. From 2004 to 2015, data from NASA’s Terra satellites and Brazil and China’s CBERS-2b were used, with a spatial resolution of 250 m. With these images, it was possible to issue deforestation alerts for areas larger than 25 ha. However, they did not allow DETER to differentiate between completely deforested areas and other areas suffering progressive degradation.
From 2015 onward, images from CBERS-4 and CBERS-4A and the Amazonia-1 satellite, which were designed and operated by the INPE, with a spatial resolution between 56 and 64 m, were used. “Today, DETER only uses images from satellites developed with Brazilian technology,” highlighted Almeida. This change enabled reducing the minimum warning area to 3 ha and separating alerts into two classes: deforestation and degradation. One of the three satellites passes over any given part of the Amazon at least every two days. This high frequency allows for continuous monitoring of the region, indicating that deforestation alerts can be issued in near-real time.
The total or partial removal of native vegetation in an area with no previous record of clearing is classified as new deforestation. Although it is not possible to define the exact day when the forest was removed in a given area, DETER associates the event with the date on which the satellite image was taken.
New areas are identified on a daily basis and manually, similar to PRODES, but by a different team of specialists. Ten technicians at INPE’s Belém unit analyze the images on computers. Deforestation alerts are separated into the categories of clearcutting, deforestation with vegetation, and deforestation due to mining. The degradation warnings include geometric selective logging, disordered selective logging, and wildfire scarring.
With this approach, the system can differentiate natural disturbances from ones caused by human activity. The former mostly exhibits irregular, nonlinear shapes, while the former generally exhibits geometric and linear clearing patterns.
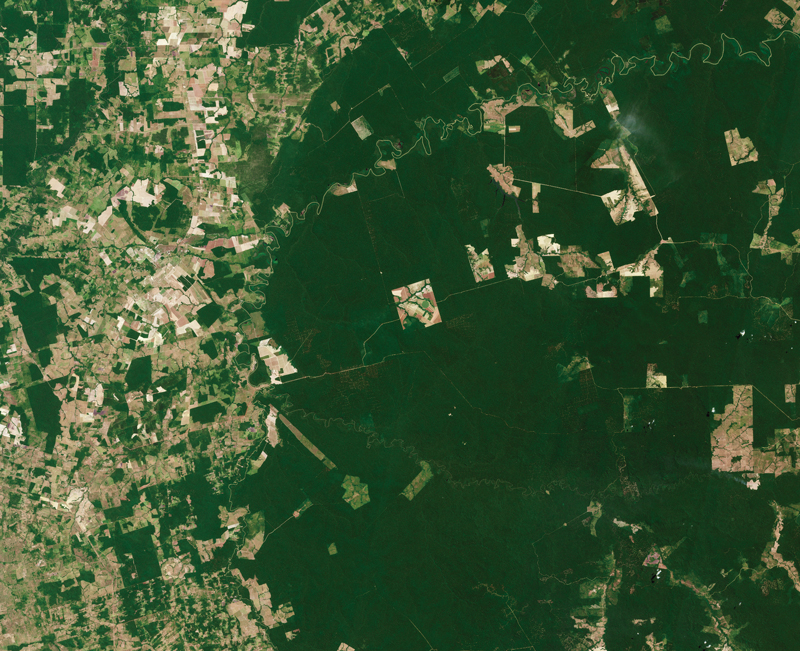
Copernicus Sentinel 2 / ESAAreas of preserved and deforested rainforest near the Capim River in Pará, 2022Copernicus Sentinel 2 / ESA
SAD
In Belém, Imazon created the Deforestation Alert System (SAD) in 2008. Its objective is to monitor forest degradation and the clearing of native vegetation in the Legal Amazon on a monthly basis to shed light on associated dynamics and trends. “Having alternatives to PRODES and DETER gives civil society security and autonomy in the event that the INPE initiatives fail or are discontinued,” said Carlos Souza Jr., of Imazon.
The SAD system records clearcutting and degradation in areas as small as 1 ha. It uses images from the American Landsat 8 and 9 satellites and the European Sentinel 1A and 1B (both 20-m pixels) and Sentinel 2A and 2B (10-m pixel) satellites. Any given point in the Amazon is scanned by one of the satellites every five to eight days.
The images are initially analyzed automatically using the Google Earth Engine, but they are all validated by experts before the data are finalized. The SAD publishes monthly deforestation statistics for the entire Amazon and the states in which it is located, as well as annual deforestation rates. “Normally, our data show 70% to 80% of the value recorded by PRODES, which we see as a strong performance given the methodological differences,” explained Souza Jr.
MapBiomas
In 2015, the MapBiomas network began producing maps and data on changes in land use in Brazil (e.g., the presence of vegetation, agricultural activities, and urban structures) based on remote sensing images automatically analyzed using the Google Earth Engine. It is thus able to calculate an annual deforestation rate for all the biomes in Brazil, including the Amazon.
Four years ago, the network — run by Observatório do Clima, a nongovernmental organization (NGO) that brings together universities, technology companies, and civil organizations — launched a project specifically to monitor the clearing of native vegetation across the nation. Referred to as MapBiomas Alerta, it verifies and refines deforestation warnings issued by other systems, such as DETER and SAD, and produces a public report for each area suffering deforestation.
These data are published weekly by MapBiomas Alerta and consolidated every year in an annual deforestation report (RAD). “Despite its name, MapBiomas Alerta does not provide warning about ongoing deforestation,” explained geographer Marcos Rosa, a technical coordinator at MapBiomas. “It uses high-resolution images to confirm whether deforestation has occurred in an area and cross-references this information with public data to classify the type of deforestation and produce a report.”
When there is sufficient evidence that vegetation has been removed, MapBiomas employs satellite imaging from a private satellite network called Planet. According to the American company, every point on Earth is recorded daily by one of its 200 satellites, at a spatial resolution of just 3.7 m. This suggests that the smallest visible area within a Planet image covers approximately 14 m2, the size of a room in a house.
Every verified and refined alert produced by the SAD includes a report with high-resolution images before and after deforestation. The MapBiomas system can also be applied to cross-reference the geographic information of deforested areas with data from various public databases, such as the Rural Environmental Registry (CAR) and the Land Management System (SIGEF). “We are thus able to include information about the deforested area in the report and infer signs of illegality,” explained Rosa.

NASA / LandsatSatellite image from 2018 shows the region around the Amazon River covered by clouds, a feature that makes forest mapping by remote sensing more difficultNASA / Landsat
GFW
There are also international initiatives that publish regular data on deforestation in the Brazilian Amazon. The Global Forest Watch (GFW) is possibly the most impactful. Operated by scientists from the University of Maryland, USA, and funded by the World Resources Institute (WRI), a nongovernmental organization based in Washington DC, the GFW has been monitoring land use and deforestation since 1997, especially in tropical forests, such as the Amazon.
The initiative uses Landsat images and has adopted the minimum spatial resolution of these satellites as the smallest monitoring area of deforestation: 1 pixel of a Landsat image, measuring 0.09 ha. The information is processed automatically.
“The system focuses on the tree canopy above 5 m. It records the cutting of trees and the removal of vegetation by fire,” said geographer Jefferson Ferreira, head of the WRI’s program in Brazil. “It shows the loss of forest cover, whether due to deforestation or not.” The GFW publishes an annual deforestation rate for the Amazon every year, calculated from January to December.
System limitations
No deforestation monitoring system is perfect. Remote sensing satellites, which generally capture images in the infrared and visible light frequency bands, face a common problem: if there are clouds between their cameras and the Earth, the resulting images are often of little or no value. Data redundancy and the use of images from more than one satellite are therefore particularly important strategies.
Microwave-frequency radars on satellites can also be employed to overcome this obstacle. These observations are not blocked by clouds and can be obtained during the day or at night. “The CBERS-6 satellite will feature radar technology,” said Galvão.
Although faster and less expensive, fully automated analysis of deforestation may overlook some forms of clearing that a trained human eye would spot, and it can even lead to erroneous alerts. “It is important to know the historical and geographical context of the location of the apparent deforestation,” stressed Câmara. “Sometimes, automatic systems can interpret an image of an Amazonian floodplain obtained during the flood season as a sign of vegetation having been removed. However, this conclusion is wrong.” The image of a flooded floodplain resembles that of a clearcut area of forest. However, a technician must analyse only an image of the same area recorded during the dry season to verify whether vegetation is still present.
Despite criticism, Câmara is an advocate of machine learning for assisting remote monitoring of the Amazon. In 2014, he obtained funding from FAPESP’s eScience program for a study on the use of big data from satellites to classify land use and cover with the aid of machine learning.
Based on this research, the remote sensing specialist obtained funding from other sources to develop free software, namely, satellite image time series analysis (SITS), which is currently in the final testing phase to potentially replace PRODES. According to Câmara, the use of state-of-the-art deep learning methods makes it possible to achieve a 95% consensus between the visual interpretation of images by humans and the analysis performed by algorithms.
There has never been so much information available on deforestation dynamics in the Amazon, which is necessary for the implementation of public policies designed to improve forest management and maintenance. “Every monitoring system makes the manager and society look at the problem differently. Today, we know the extent of deforestation, where it is occurring, and how fast. Sometimes, we can even identify who is doing the deforesting,” noted Ane Alencar, director of science at the Amazon Environmental Research Institute (IPAM). “The main challenge is to better understand the level of illegality of deforestation and implement more efficient enforcement actions, embargoes, and even restrictions on access to credit [for those who remove native vegetation].”