
NASA / EARTH OBSERVATORYA classic from 1968: The Earth seen by the Apollo 8 team, the first manned mission to orbit the Moon.NASA / EARTH OBSERVATORY
The Moon, the largest celestial object near Earth, influences more than the level of the oceans. Similar to how it makes waters rise and lower throughout the day, the Moon also deforms Earth’s atmosphere—not much, just about 1 meter—and elongates it like an American football. This subtle stretching, due to lunar gravitational attraction, generates disturbances in the upper atmosphere that have now been mapped on a global scale by a team from the National Institute for Space Research (INPE). The group, coordinated by physicist Paulo Prado Batista, used data collected over a period of 10 years by a US satellite designed to study the upper atmosphere of the Earth, and produced the most detailed survey of temperature variations at altitudes above 30 kilometers (km)—three times higher than commercial aircraft fly.
The researchers found that the band between 30 km and 110 km above the Earth—including the stratosphere and mesosphere, with the lowest atmospheric temperatures in the latter, up to -100°C—the temperature can oscillate up to 8°C during a day due principally to the influence of lunar gravitational attraction. The force exerted on the planet by the Moon causes vibrations in the lowest layers of the atmosphere that propagate to the highest layers in the form of waves similar to those generated when shaking a rope. These waves, known as lunar tides, make the atmosphere pulse in a manner similar to how they make the surface of the ocean oscillate. “In the oceans, the gravitational pull of the moon manifests itself as a change in height, whereas in the atmosphere it alters the temperature or wind speed,” explains Batista. He and physicists Inez Staciarini Batista, a researcher at INPE, and Ana Roberta Paulino, his former doctoral student at INPE, published details of this mapping in December 2013 in the Journal of Geophysical Research.
 The variations observed by the three scientists become larger as altitude increases, and reach a maximum at about 110 km, where the air is more rarefied and the gas density is lower. These temperature fluctuations occur in cycles lasting 12 hours and 25 minutes, similar to lunar tides. The period corresponds to the time it takes for the Earth to turn around its axis so that the point of its surface that is closest to the moon becomes the most distant. Both the Earth’s rotation and the motion of the Moon occur in the same direction, but the Moon moves more slowly—this is why this time is greater than 12 hours. Since the gravitational attraction between two bodies depends on the distance between them, the closer the moon, the greater the force, and vice versa. The atmosphere is deformed both at the maximum and minimum values of gravitational force: in the former, because the attraction is more intense, and in the latter because it tends to escape when the force is weaker. This combination is why the atmosphere takes the shape of an American football.
INPE’s mapping provides the broadest evidence that lunar tides in the atmosphere, whose existence had been questioned, do indeed exist and are important to understanding the weather of a region of space inhabited by research and communications satellites.
When he formulated his universal law of gravitation in the late 17th century, the English physicist and mathematician Isaac Newton proposed that, similar to how the moon causes fluctuations in the level of the oceans, it could also influence the atmosphere, which also behaves like a fluid. Pierre-Simon Laplace, a French mathematician and astronomer, studied the topic again about a century later, but the observational data available were insufficient. Only in 1846 did the English Colonel Edward Sabine publish the first measurements of lunar tides in the atmosphere deemed to be reliable. They were made at the Observatory on the British island St. Helena, off the west coast of Africa. But both these measurements and those made in the first decades of the 20th century were local measurements. Now, with the aid of the TIMED satellite, data has been collected on the stratosphere and the mesosphere for a region that extends from the 50th parallel North, the latitude of Canada and Russia, to the 50th parallel South, the latitude of New Zealand and southern Chile and Argentina.
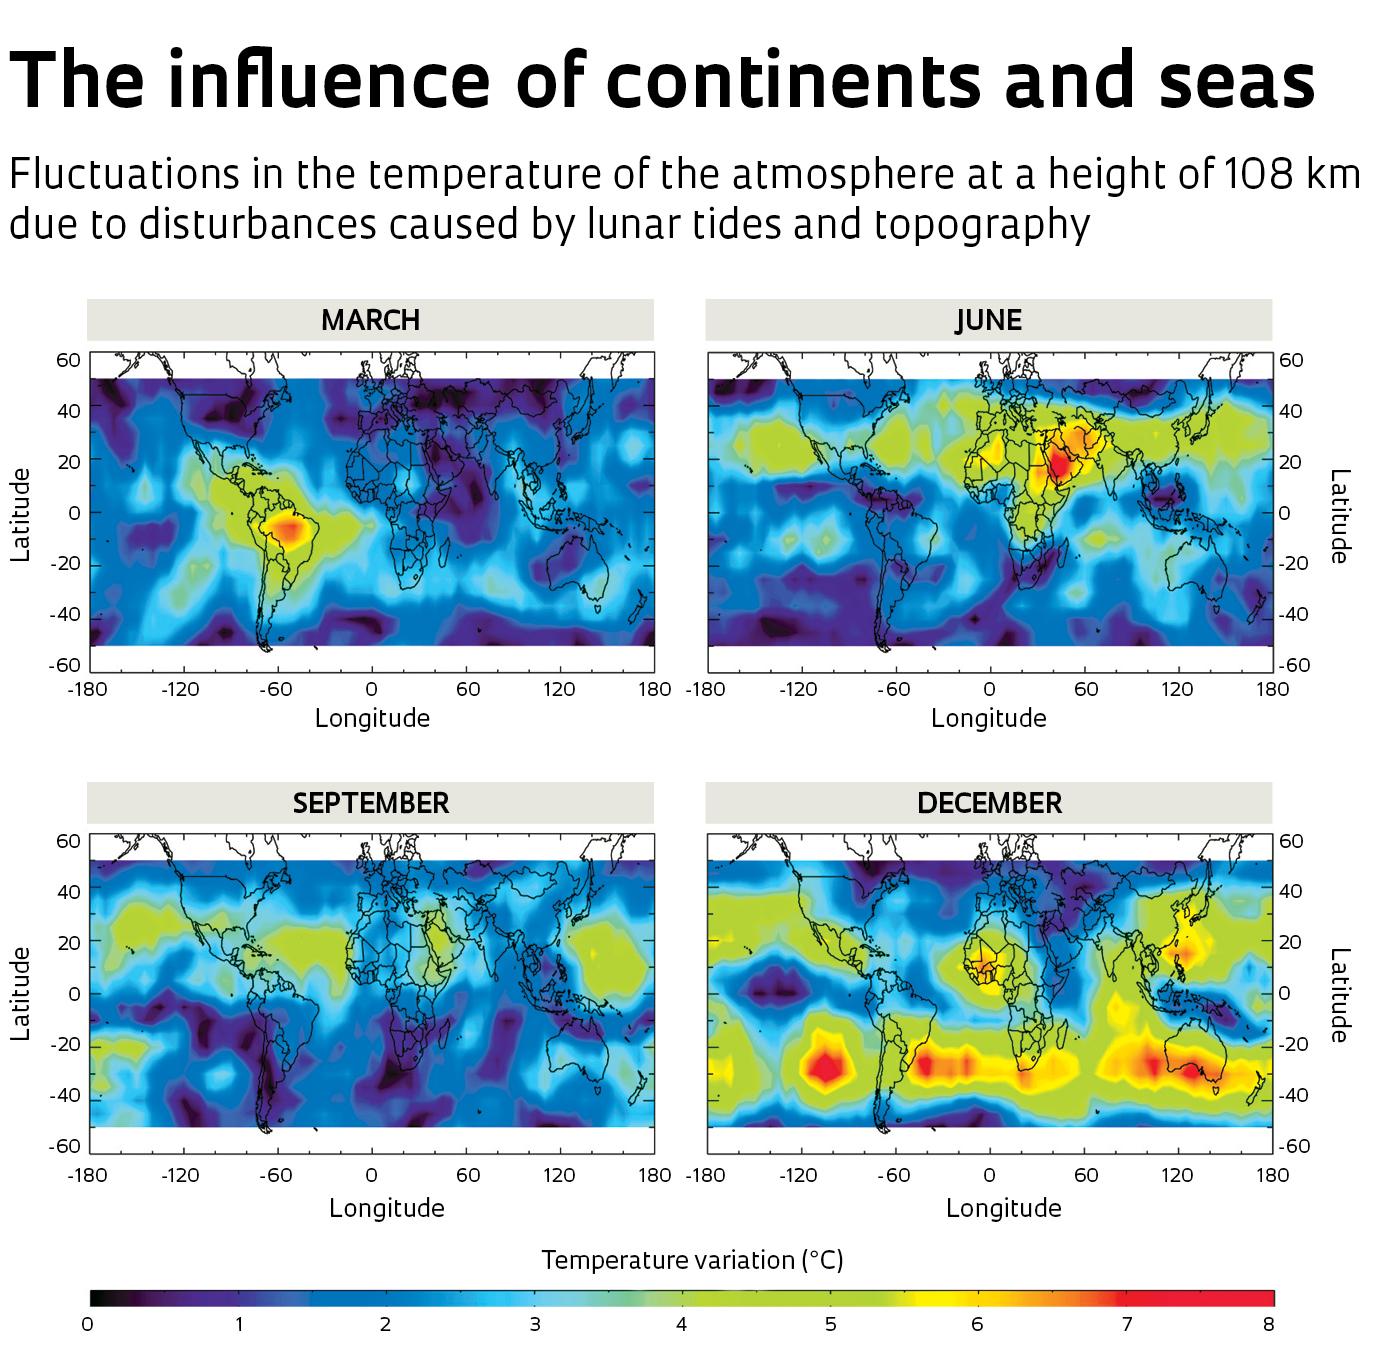
The propagation of these tides in the atmosphere agitates the gas molecules, resulting in an increase in the temperature. The data collected from 2002 to 2012 by the satellite TIMED show that the thermal variations are greater in December and January in much of the upper atmosphere, and weaker between March and May. They also occur with greater intensity from June to September in the Northern Hemisphere and in November and December in the Southern Hemisphere. According to Batista, these latitude-dependent variations were already well explained by two factors: the eccentricity of the Moon’s orbit (its trajectory around the Earth is not circular, but rather elliptic); and by the combined influence of the Moon and the Sun on the atmosphere’s temperature (while the moon alters the temperature through gravitational attraction, the Sun affects it via radiant energy).

NasaThe atmosphere in profile: The Space Shuttle Endeavour with the troposphere (orange), stratosphere (yellow) and mesosphere (blue)Nasa
Longitudinal Variation
One result, however, surprised the researchers. In addition to latitude variations, they also observed longitudinal variations (east-west). In some months of the year there were temperature fluctuation peaks in localized regions of the upper atmosphere over the Amazon, Africa and the Pacific Ocean. According to the physicist, some longitudinal effect was even expected, but not of the intensity observed—as the Earth spins on its axis, all points on the longitudinal axis are exposed to the same lunar attractive force at some point in time, and this would homogenize this influence. “We were able to separate the influence of the lunar component from the other perturbations in the atmosphere,” says Paulino, now a researcher at the State University of Paraíba in Campina Grande.
“Our data indicate, however, that the characteristics of the Earth’s surface are reflected at very high altitudes,” explains Batista. “The deformation of the atmosphere due to the gravitational pull of the Moon is influenced by the distribution of seas and continents on the globe,” explains the physicist. Moreover, Batista continues, “we have seen that the fluctuation in sea levels (ocean tides) affects the atmosphere more than expected.”
The implications of these findings are not restricted to the theoretical plane. From a practical standpoint, better understanding of the variations in temperature in this range of altitudes in the upper atmosphere should allow the development of more accurate models of the weather at a still higher altitude—the ionosphere, located between 100 km and 1,500 km from the Earth—where research and communication satellites orbit and the concentration of electrically charged particles is high. “To precisely model the ionosphere, one can no longer ignore phenomena such as lunar tides,” says Batista.
“This global mapping of lunar tidal effects is of great importance for predicting space weather,” says engineer Clezio De Nardin, current manager of the Brazilian Center for the Study and Monitoring of Space Weather (Embrace), INPE. Lunar tides are one of three factors that trigger the formation of bubbles in the ionosphere. The other two are: the electric fields around the Equator and meteorological phenomena such as the formation of storm clouds; the movement of cold fronts or intense winds in the lowest layer of the atmosphere (the troposphere), where 90% of gases are located.
Ion bubbles
The bubbles are regions with a lower ion density. In general, they begin to form in the early evening at an altitude of about 250 km in the vicinity of the Earth’s magnetic equator, near the geographical equator. The lunar tides, explains De Nardin, drive the development of these bubbles that can reach diameters of thousands of kilometers.
Since they are less dense than the surrounding environment, as the bubbles grow they rise to higher altitudes, which reduces the concentration of ions in the upper atmosphere. This change in ion density makes the passage of radio waves emitted by satellites difficult, or even blocks them. This includes low-orbit communications satellites (altitudes of 400 km–600 km), GPS satellites (altitude of 22,000 km), and geostationary communication satellites, which orbit the Earth at a height of 36,000 km. “When bubbles are present, satellite communication is highly degraded or even interrupted, sometimes for hours,” recounts De Nardin. This interruption affects air and maritime navigation, oil exploration and precision agriculture. “If no action is taken, it can last long enough for a boat on the high seas to get lost, or for an oil exploration pipeline to break,” he explains.
According to De Nardin, the mapping undertaken by Batista’s group shows that periods of more intense lunar tides coincide with the high season for bubbles in the ionosphere, which runs from November to March. “This survey helps us to better explain and predict the period in which bubbles are more likely to occur,” says De Nardin. Batista adds, “We cannot prevent the formation of the bubbles, but we can help avoid satellite problems by predicting when they will occur with greater precision.”
Scientific article
PAULINO, A.R; BATISTA, P.P. and BATISTA, I. S. A global view of the atmospheric lunar semidiurnal tide. Journal of Geophysical Research: Atmospheres. V. 118, p. 13.128-139. Dec. 16, 2013.