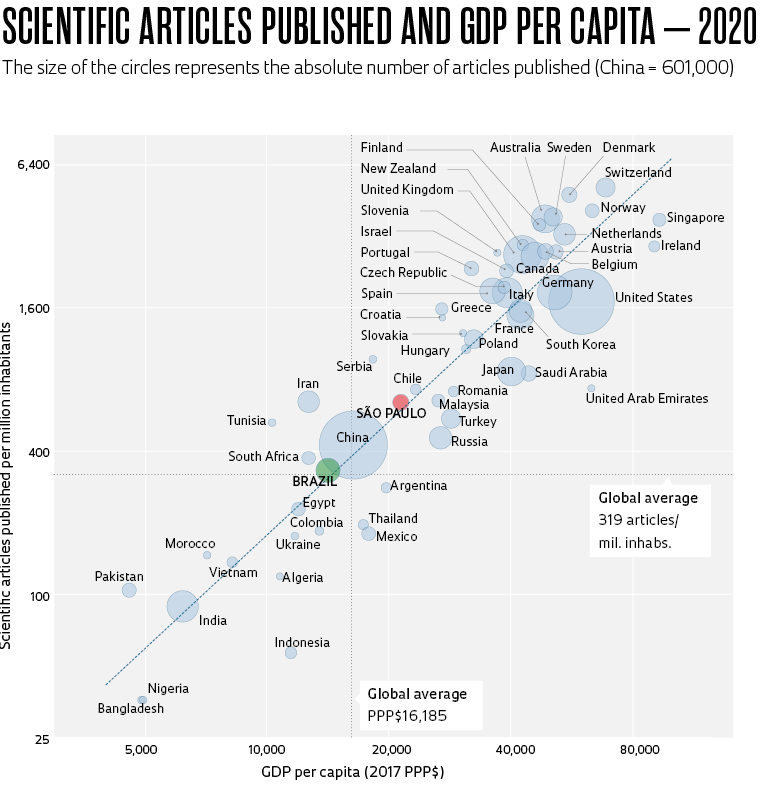
- The graph below presents data on Gross Domestic Product (GDP) per capita1 and scientific articles published per million inhabitants2 for selected countries3 and for the state of São Paulo, to allow for comparison
- The dotted lines represent the global averages. Brazil is close to the average, while São Paulo is above
- The size of the circles represents the absolute number of articles published by each country, led by China (601,000) and the USA (561,000)
- The two axes are in logarithmic scale to allow countries with very different data to be included in the same graph
- The dashed line shows the results of the linear regression of variables transformed by the logarithm
- The results indicate that a 10% increase in GDP per capita is associated with a 16% increase in the number of articles published per million inhabitants
- Brazil and São Paulo are almost exactly on the linear regression line, indicating that their numbers for articles published per million inhabitants are in line with expectations based on their GDP per capita

- With respect to the other BRICS nations, the situation was similar to Brazil in China and India. The number of papers published per million inhabitants was lower than expected in Russia and slightly higher than expected in South Africa, given their GDPs per capita
- The table to the right shows the same variables in 2010, 2015, and 2020, allowing for a comparison over time of the BRICS nations, South Korea, the state of São Paulo, and the global average
1 Gross Domestic Product (GDP) is expressed in Purchasing Power Parity (PPP$) according to the World Bank’s 2017 values. For São Paulo, the conversion table for Brazil was used. 2 Articles indexed by Incites/Web of Science, classified as Articles, Proceedings Papers, and Reviews. 3 Group of 57 countries with at least 5,000 papers published in 2020. SOURCES Incites/Web of Science/Clarivate, accessed in June 2022. Populations and GDP (constant PPP$ 2017): World Bank, accessed in 06/2022. São Paulo data: IBGE and Fundação Seade, consultation in June 2022. Prepared by: The FAPESP Studies & Indicators Team (DPCTA)
Republish

