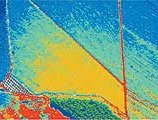
JANSLE ROCHA / UNICAMPIn the image taken from an airplane, the area with a lot of biomass is blue, with a little, green, and in between, yellow. The soil is red.JANSLE ROCHA / UNICAMP
Sugar cane planters can now leave aside the old problem of the difficulty of estimating with precision the crops that will be harvested. The solution lies with a new methodology developed by the researchers from the Geoprocessing Studies Group, of the School of Agricultural Engineering of the State University of Campinas (Unicamp). With digital images captured by sensors installed in aircraft and satellites, they make available to farmers a system that makes it possible to foresee, four to five months in advance, the tonnage of the production of sugar cane in a given area.
Under the coordination of Professor Jansle Vieira Rocha, the group has achieved the unprecedented feat of using satellite images to calculate the variability of the biomass in the cane crop. The methodology employed is at the stage of being patented by Unicamp. A preliminary test carried out at Usina São João Açúcar e Álcool, in Araras (SP), which gave field support to the project, showed that the errors in the assessment of biomass fell from 15% to 2% in some areas, with the help of satellite images. For the sugar and alcohol sector, this means a great step forward. This mill’s production of sugar cane came to almost 3 million tons in the 2000/2001 harvest.
A 15% error on this total corresponds to 450,000 tons. As the producer usually negotiates in March the sugar that is going to be produced from December onwards, it does not matter whether the forecasts of the harvest are over or under-estimated, these errors always bring losses. In partnership with two researchers from Unicamp’s Center for Teaching and Research in Agriculture (Cepagri), Rubens Augusto Camargo Lamparelli and Jurandir Zullo Júnior, the project was awarded a prize at the end of last year, at an event where over 150 works from all over the world were presented, the Third International Conference on Geospatial Information in Agriculture and Forestry, which took place in Denver, in the United States.
Another Brazilian study also won a prize at the same event. Under the coordination of José Alexandre Demattê, from the Department of Soils and Plant Nutrition of the Luiz de Queiroz College of Agriculture (Esalq), of the University of São Paulo (USP), and the participation of Marcos Nanni, from the State University of Maringá (UEM), it showed the potential for remote sensing, applied in estimating the components of the soil. The satellite images were used to map the variability of the composition of the ground, to assess its components, and to serve as a guide for farmers, indicating the areas where samples should be collected for a survey of the soil and for laboratory analyses.
Precise calculations
In the study by the researchers from Unicamp, the original objective was purely academic – to compare three different methods to measure biomass in sugar cane plantations: by radiometry (with a sensor installed on the ground), multispectral videography (on board planes or helicopters) and satellite images. The radiometer makes possible very precise measurements, but its coverage, 17 x 17 cm, does not allow measurements to be done in extensive areas. The aerial images give a panoramic vision and at the same time a detailed one – each dot of the image (pixel) corresponds to an area of 25 x 25 cm -, but the cost of the operation is high.
Then there are the orbital images, such as those from Landsat 7, used in the project, which have pixels of 30 x 30 m, making it difficult to visualize the details, but which have the advantage of covering images of very extensive areas, 185 x 185 km. “With 19 images, we can map the whole of the state of São Paulo”, says the researcher. The cost is still relatively high: R$ 1,200.00 per image. “But the tendency is for the price to fall over the next few years, with the launching of new satellites”, says Rocha. “Furthermore, the images can be purchased using the cooperative system, which makes its use practicable for small farmers”.
But while they were mapping the 36-hectare area allowed for research by Usina São João, in the search for correlation between the three systems of measuring, the researchers soon noticed that the maps they generated had an immediate application. They could be used as a guide for the field supervisors – technicians from the mills charged with providing an estimate of production. Nowadays, the supervisors drive their cars along the roads that border the extensive planted areas, look at the general state of the plantation, and, based on experience, they estimate what the production of that area will be.
“They have a lot of experience in this work and are capable of making good estimates”, explains Rocha. “The problem is that they assess only what they can see, that is to say, the sugar cane on the outside, but productivity in the plantations is usually very heterogeneous”. While some areas produce 95 tons a hectare, others produce only 50 tons a hectare.
This variability occurs for various reasons – different kinds of soil, fertility problems, pests attacks, weeds invasion, problems with excess water – and they can often only be seen from the air, or in a satellite image, where the lighter, or yellow, patches show areas of lower productivity, and the darker ones, or red ones, show the more productive areas. “With these maps in his hands and the help of a GPS (Global Positioning System), the field supervisor will be able to identify the areas that are more or less productive, and, based on this, choose the places that need to be closely evaluated”, says the researcher.
More precise estimates are important for avoiding a repetition of the problems faced by the sector as a result of an incorrect forecast of the harvest last year. “We had an estimate that production in the Center-South region of the country would be 220 million tons, but at the beginning of December, before the harvesting was concluded, production had already hit 232 million tons”, explains João Martins, Usina São João’s agricultural manager.
“Those extra 12 million tons of sugar cane produced will be absorbed in the production of alcohol, generating an excess of 1.10 million cubic meters, which should make the price of the product plunge on the market”, says Martins. In an opposite situation, if the forecast were 10% lower than the harvest, the problem would be worse still. “We could have a fall in the price of sugar at the moment of negotiations and a certain loss at the time of delivery”, he says.
Passing on technology
The researchers from Unicamp got plenty of phone calls from businessmen in the sector interested in the new methodology. The group is now prepared to meet the demand, and the new technique should be passed on in two years time. “In the first year, we are going to produce maps and to give courses so that the technicians can learn how to interpret the images. In the second year, we will be implementing the software and supervising the work at the sugar mills”, says Rocha. The companies will have to bear the costs of the images, the training of personnel and the services supply.
Usina São João does not want to stay out. Next year, the researchers are going to expand the study area and to cover all the 40,300 hectares of the mill. The research project finishes in April, but for the researchers it was just a beginning. “We started out from a single research aid program and opened up an huge field for work”, says the researcher. At the moment, seven students are dedicating themselves to research on themes related to variability in the production of sugar cane – there are two studying for a doctorate, three for a master’s degree and two students doing scientific initiation.
Planned use
Another job that also has a wide field of application in agriculture is being done by Professor Demattê, from the Department of Soils and Plant Nutrition at Esalq. With the help of a sensor installed in the laboratory and satellite images, he is building the foundations of a technology for helping in mapping and evaluating soils. The soil maps are important information for precision agriculture, which has as its main objectives the increase of productivity and the preservation of the environment. “Knowing the characteristics of the soil is the basis for any planning of the use of the land”, says the researcher. “But in Brazil we have a very great shortage of more detailed maps”.
The use of sensors in studies to characterize the soil is no novelty. Research began in the 70’s, but it was only from the next decade onwards, with the evolution of sensors and the widespread use of the GPS, that they picked up momentum. “The results of research, when related to the quantification of the attributes of the soil, were in development, but today we are resuming this work to revise the foundations and to make progress, as support for precision agriculture”, Demattê explains.
Since 1995, together with students doing scientific initiation and those studying for master’s and doctor’s degrees, he is carrying on basic research in this area. “Our proposal is to ally to the traditional methodology a new way of studying the soil, that is, from the electromagnetic energy it reflects. The use of sensors in agriculture is a process in continuous development”.
Reflected energy
The first steps have shown that the analysis of the soil with the use of sensors is capable not only of differentiating classes of soil, but also to quantify various components, such as clay, iron, titanite, silt and organic material. At this stage of the study, the researcher used an IRIS spectroradiometer installed in the laboratory. The soil samples are exposed to a source of halogen light, and the sensor captures the energy that they reflect at the different wavelengths. This information is recorded as reflectance curves, which indicate several characteristics of the soil, allowing it to be identified and described. As the results advanced,
Demattê went on to quantify the elements of the soil. The study of reflectance was carried out in parallel with chemical analyses in the laboratory, using traditional methodologies, which served as a basis for comparison.The next step was to use remote-sensing to map a 198-hectare area in the municipality of Rafard, in the region of Piracicaba. With the help of a GPS, sampling points were marked, one per hectare. At each point, two samples were collected, at depths of between 0 and 20 cm and 80 to 100 cm. The 396 samples obtained were analyzed with the laboratory’s sensor.
“We tried to follow a routine that is already established among the farmers. They bring their samples to the laboratory, where they are analyzed by the traditional method. What we did was to use another method, also physical, although based on information obtained by sensors, without there being any contact with the sample of earth”, explains the researcher. The spectral information from these samples was then compared with the results of the chemical analyses. “We were able to observe a very high correlation between the two methods for determining, particularly, clay, sand, iron, organic material and even (CEC) cation exchange capacity [RS9]”.
It was only from this point onwards that Demattê started to use the satellite images. The information on reflectance from the satellite image of the place the samples were collected were compared with those obtained in the traditional laboratory analysis. “We also obtained good correlation, particularly for clay and iron. This showed that there is enormous potential for the use of sensors installed in laboratories and other platforms for studying the soil”, says the researcher.
But the objective, at least in the short term, is not to replace the traditional analyses. The idea is that the maps obtained using images may be used as an instrument to guide farmers in identifying the soil classes and their chemical and physical characteristics, assisting in the choice of the most suitable spots for collecting the samples for a traditional survey and fertility analysis.
Details of the soil
At present, the choice of places for collecting soil samples is made on the basis of the differences of colors, relief , or type of crop. “In this way, the farmer may be spending more money on laboratories and supplies because he has not collected samples from the right places concerning of fertility, that is, he could be using fertilizer in excess, or applying less than necessary. In short, he loses in productivity and degrades the environment”, Demattê points out. Another advantage of more detailed mapping of the soil is that it enables farmers to identify areas with a high risk of erosion.
Knowing this, the farmer can handle the soil properly and avoid the loss of productive areas. For the time being, the studies involving remote-sensing do not allow recommendations for the fertility purposes, that is, for identifying the nutrients present in the soil. But by identifying physical differences and some chemical ones, they help in the handling and rational planning of the soil, transforming themselves into a modern and advanced tool for agriculture.
The projects
1. Remote Sensing Applied to the Mapping of the Spatial Variability of the Productivity of Sugar Cane for Precision Agriculture (nº 99/07071-1); Modality Regular line of research benefits; Coordinator Jansle Vieira Rocha – Flagri/Unicamp; Investment R$ 83,339.61 and US$ 13,837.00
2. Assessment Radiometric Data Obtained at Ground and Orbital Levels in Characterizing and Mapping Soils (nº 98/03516-6); Modality Regular line of research benefits; Coordinator José Alexandre Demattê – Esalq/USP; Investment R$ 28,145.75 and US$ 8,098.00