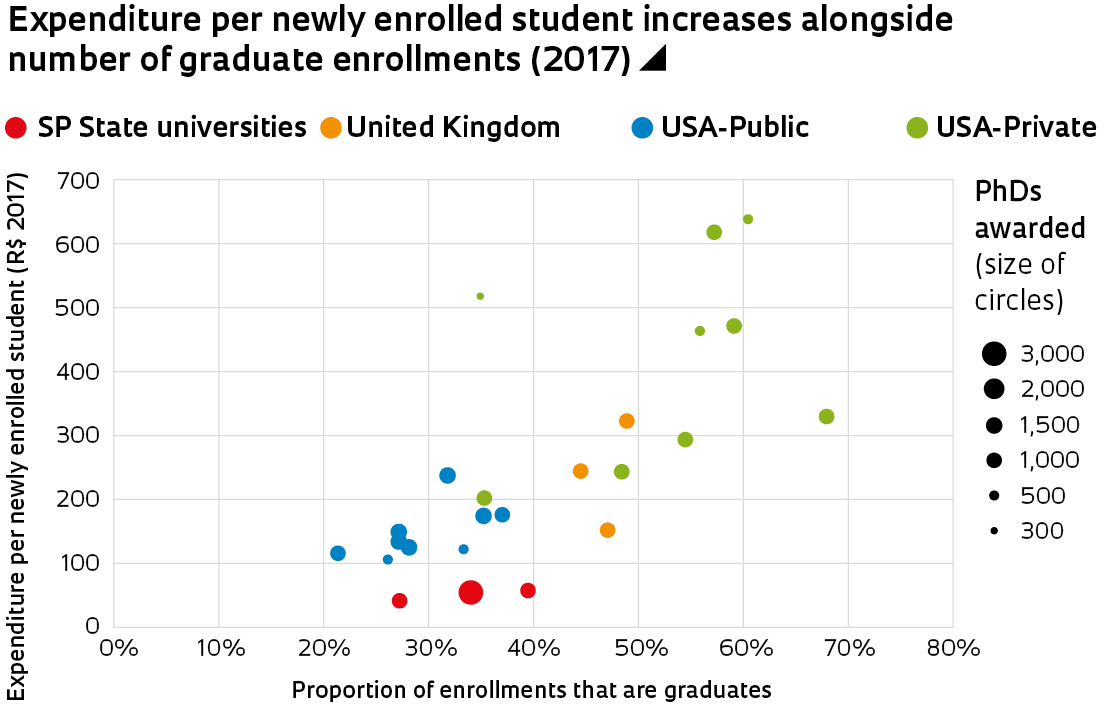
- The table below presents 20171 data on the number of undergraduate and graduate (grad.) enrollments2, PhDs awarded2, total expenditure3.4, and expenditure per newly enrolled student at universities that focus heavily on graduate studies (at least 20% of students studying at graduate level), including the São Paulo state universities, 18 public and private (nonprofit) institutions in the USA, and three British universities.

- Despite being the best-funded public universities in Brazil, the data shows that expenditure per enrollment at the São Paulo universities is much lower than at the other institutions analyzed, including public universities in the USA.
- The graph indicates that the greater the number of graduate students, the higher the institution’s expenditure per student, which is confirmed by linear regression of the expenditure per student logarithm as a function of the percentage of graduate enrollments5.
- This regression suggests that increasing the proportion of graduate enrollments by 10% is associated with a 40% increase to the spend per student enrolled at the institution (for this group of institutions).
Notes (1) For the USA and UK, data refers to the 2017–2018 school year, except for Cambridge University, which is for 2016–2017. (2) For the USA and UK, enrollments and PhDs awarded include all doctorate types, which in Brazil are only academic degrees. No PhD data available for Cambridge and Oxford universities. The circles on the graph for these institutions were generated for 1,000 PhDs, for illustrative purposes only. (3) Expenditures include all types of education, research, and services, except those in university hospitals and healthcare centers, which vary greatly in characteristics both within Brazil and abroad, and are often part of larger health service systems. (4) For the USA and UK (excluding Cambridge, 2016/2017), values were converted using 2017/2018 purchasing power parities (PPP$), which take into account the real price differences between countries. For the São Paulo state universities, inactive expenses were not counted, which are also not included for the other institutions analyzed. (5) Excluding Harvard and Princeton, which exhibit atypical behavior, the value of R is 0.92.
SOURCES USP, UNICAMP, UNESP: 2018 ANNUAL REPORTS, STUDIES AND INDICATORS/ST&I INDICATORS, FAPESP. OTHER INSTITUTIONS: FINANCIAL/BUDGET REPORTS, COMMON DATA SETS FROM THE INSTITUTIONS, AND CARNEGIE CLASSIFICATION, UNIV. INDIANA. PPP$ INDEX: HTTPS://DATA.OECD.ORG/CONVERSION/PURCHASING-POWER-PARITIES-PPP.HTM
Republish