An international collaboration of at least 200 scientists, including four Brazilian researchers, has developed the most accurate and comprehensive reference charts to date for the development of the human brain throughout life. The team, led by neuroscientists Richard Bethlehem, at the University of Cambridge, UK, and Jakob Seidlitz, from the University of Pennsylvania, USA, used 123,984 magnetic resonance imaging (MRI) scans from 101,457 individuals to build charts showing how the volume of the brain—and of some of its individual components—changes with sex and age. These charts are a first step toward the future development of a simple tool for pediatricians to determine whether a child’s brain is developing normally, and whether brain volume decline in adults and elderly is consistent with their age or indicative of a neurodegenerative disease.
Published in an April 6 paper in Nature, the new charts are outwardly simple: a series of curved dotted lines—some more and others less inclined—indicating the expected area, volume and thickness of the brain (or of different brain components) with age. It resembles a pediatric growth chart showing the expected height and weight ranges for each age, which pediatricians use to assess whether children are developing normally relative to their peers.
The brain charts have allowed the researchers to confirm developmental milestones that have previously only been hypothesized, such as at what age the brain’s major tissue classes reach peak volume and when specific regions of the brain reach maturity. “One of the things we’ve been able to do, through a very concerted global effort, is to stitch together data across the whole life span,” Bethlehem wrote in a press release. “It’s allowed us to measure the very early, rapid changes that are happening in the brain, and the long, slow decline as we age.”
Early childhood brain growth is impressive and even higher than experts previously thought. At around mid-gestation, the brain has just 10% of the peak volume it will reach in early adulthood. Just three years after birth, however, it will already have reached 80% of the maximum size it will ever attain. “This suggests that the first 1,000 days of life, from gestation to the second year after birth, have a lasting influence on the physical and mental integrity of the brain,” says Ricardo Nitrini, a neurologist at the University of São Paulo (USP) who was not part of the study.
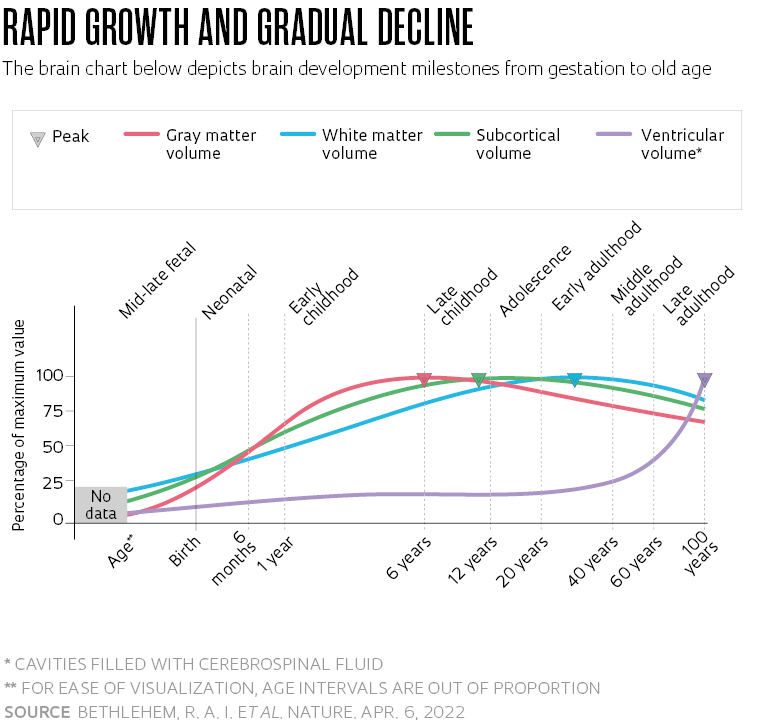
The brain increases in size until age 30, and then begins to lose volume, first slowly and then more sharply from age 60. The rate of growth and decline, however, is not homogeneous. It varies across the three main components into which the brain is normally divided: cortical gray matter (sometimes known as the cerebral cortex), subcortical gray matter and white matter. This pattern was already surmised and even known to experts, as white and gray mass are different in nature and have different development patterns. What was not known for certain was when each component reaches its peak size and development.
Cortical and subcortical gray matter essentially consist of neurons and other central nervous system cells. Their pinkish-gray hue derives from a specific portion of the neurons they contain: the cell body, an approximately spherical region that contains both the nucleus (where genes are found) and the machinery that keeps the cell alive and functioning. The gray matter also contains small branches called dendrites, which connect neurons to each other. White matter consists of axons, the longest portion of the neuron, which operate like a power cable. It is covered with a layer of fat that gives it a pale-yellow hue—hence the name white matter—and carries the electrical signals fired by the cell body of one neuron to another. Axon bundles link near and distant areas of the cortex, the outermost layer of the brain, and the deep structures of subcortical gray matter.
The MRI dataset showed that the volume of gray matter increases rapidly from mid-gestation onwards, peaking just before age 6. It then begins to decline slowly (see chart). “The peak is reached at least two years earlier than suggested by previous studies with a much smaller number of participants,” says neuroscientist Andrea Jackowski of the Federal University of São Paulo (UNIFESP), who coauthored the study.
The cortex is primarily responsible for cognitive functions such as attention, memory, language, and planning, also playing a role in controlling movements and in environmental awareness. Its pace of development is also not uniform, with some regions reaching their highest volume before others. During its rapid expansion, the cortex is more vulnerable to external interferences, both chemical and emotional. “This means that it is more susceptible to harmful effects, but also that it can be more malleable to therapeutic interventions,” explains Pedro Pan, a psychiatrist at UNIFESP and one of the authors of the Nature paper. Other Brazilian participants in the study included André Zugman, from UNIFESP, and Giovanni Salum, at the Federal University of Rio Grande do Sul (UFRGS).

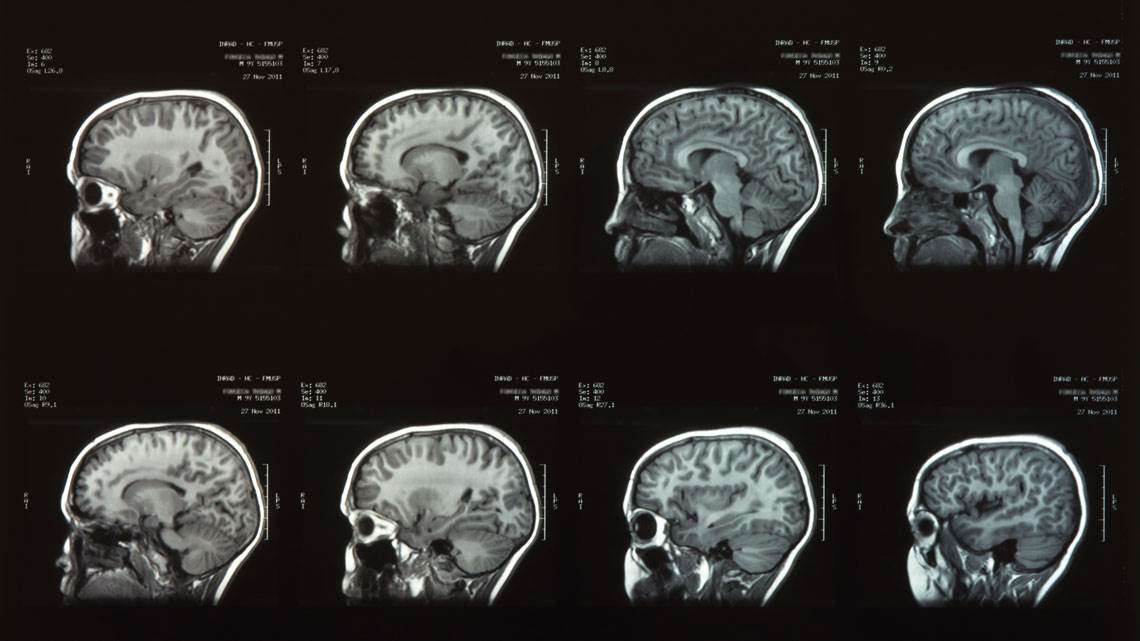
Eduardo Cesar / Revista Pesquisa FAPESPMRI scans of nearly 700 children and teenagers at USP (photo) and UFRGS were used in the studyEduardo Cesar / Revista Pesquisa FAPESP
Subcortical gray matter is the second fastest growing component. It reaches its peak volume around the age of 14, shortly after adolescence begins. Formed by clusters of neurons in the inner brain, subcortical gray matter enables individuals to control emotions, in addition to performing a number of essential body functions, such as regulating temperature, hunger, motivation, and the sleep and wake cycle. White matter, in turn, takes a little longer to gain volume. It reaches its peak at around age 29 and begins an accelerated decline from the age of 50. The spaces not occupied by these components inside the skull are filled with cerebrospinal fluid, which protects the brain and other nervous system structures from impacts and infections.
“All these components start to lose volume after they peak. The brain charts show, however, that the decline becomes more pronounced after the age of 40. Total brain volume and subcortical gray matter lose volume more precipitously after 60,” says Nitrini of USP.
In the study, the researchers also analyzed the rate of volume loss in different brain components in connection with psychiatric disorders and some neurological diseases. From the data available so far, they have observed that brain shrinkage is greater in mild cognitive decline—which causes slight memory loss—and, as expected, in Alzheimer’s disease. “In mental disorders there was also a slight difference in the rate of decline, but it was very small compared to neurodegenerative diseases,” reports Pan.
The brain development charts published in Nature are based on an analysis of nearly 1 petabyte (1 million gigabytes) of data. The charts plot expected brain volume ranges at each age over a person’s lifespan—the so-called normative trajectory of brain development—reflecting the variability found in the population. These charts, however, have not yet provided sufficiently clear milestones to allow physicians to determine whether a patient’s brain is showing a healthy pattern of development, as child development charts do for weight and height. Today, detecting something awry in the brain from MRI scans depends on the ability of neurologists and radiologists to interpret the information and, where possible, compare it with previous scans.
For the brain charts to be usable on an individualized basis, they will need to incorporate a wider amount of information including data from a greater number of individuals of different ethnicities, cultural, social and economic levels, and regions of the world. The current charts primarily used information from European and North American populations. In South America, the study included only data from Chile and about 700 children and adolescents in São Paulo and Porto Alegre, who had been followed since 2009 by researchers at the Brazilian Psychiatric Institute for Childhood and Adolescent Development (INPD), of which Jackowski, Pan, and Salum are members. “Creating these charts was a first step,” says Pan. “We are coming close to being able to test them in clinical practice.”
Project
The National Institute of Developmental Psychiatry: A new approach to psychiatry focusing on children and their future (nº 2008/57896-8); Grant Mechanism Thematic Project – INCT; Principal Investigator Euripedes Constantino Miguel Filho (FM-USP); Investment R$6,018,389.69 (FAPESP and CNPq).
Scientific article
BETHLEHEM, R. A. I.; et al. Brain charts for the human lifespan. Nature. Apr. 6, 2022.
Republish

