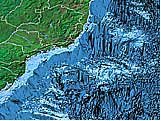
CHRISTIAN DOS SANTOS FERREIRA / FURGA 90-degree view along the Brazilian coast: plains and mountain ranges on the bottom of the Atlantic magnified 80 times, between the south of Bahia and Rio Grande do SulCHRISTIAN DOS SANTOS FERREIRA / FURG
Let us, in an exercise of imagination, accompany the view of a fish that lives hundreds of kilometers from the coast tuna fish, for example. From a point located, shall we say, 1,200 kilometers from Ilhéus, in the south of Bahia, the fish would normally see a few meters ahead. But then, for some reason or other, its field of vision increases, to the point of being able to appreciate the bottom of the sea, with clarity and in depth, in any direction. Four thousand meters below, the seabed appears like a hilly blanket. Ahead, closer to the continent, where the bottom of the sea is more or less flat, the Abrolhos Bank arises, the richest coral formation in the South Atlantic, where the National Park of the Abrolhos is located.
Turning its supergaze to the left, the tuna fish comes across an imposing submerged range of mountains and extinct volcanoes. It is the Vitoria Trindade Seamount Chain, which is born is the middle of the ocean and dies on the shore of the capital of Espírito Santo. Its highest peaks, which rise some 4,000 meters, form islands, like Trindade, 1,160 kilometers from the coast of Espírito Santo. To the right, some more modest elevations appear, of some 1,000 to 1,700 meters in height, which form the Submarine Mountains of Bahia, 444 kilometers away from the continent.
This trip is a way of understanding the three-dimensional digital map, which reproduces the contours of the seabed between the Cabo do São Tomé, in the north of Rio de Janeiro State, and the Real River, at the border between Bahia and Sergipe. This geographical chart is part of a series of maps of bed of the ocean which has just taken shape on the screens of the computers of the Oceanography Department of the Federal University of Rio Grande Foundation (Furg), located in the Rio Grande do Sul municipality of Rio Grande, 320 kilometers to the south of Porto Alegre.
“We are shortly going to make these maps public and available to any researcher”, avers oceanographer Lauro Saint Pastous Madureira, from the Fishing and Hydroacoustic Technology Laboratory, who is coordinating the work of collecting the data and drawing up the digital charts based on bathymetry, a technique that makes it possible to map the bottom of the sea (or of a river) using sound emitted towards the bottom, sound makes it possible to calculate the distance between the seabed and the surface.
Generated from the processing of data supplied by satellite and above all from measurements made with the technique of bathymetry, which registers the depth of the ocean with the assistance of echo probes (echo sensors) installed in boats, the maps detail the contours of an underwater area that begins a few meters from the Brazilian coastline and advances over 1,200 kilometers seawards. With up to 7 million georeferenced points, with their latitude, longitude and depth rigorously determined, the images of the seabed reveal what the sea water usually hides: the geological formations that constitute the bed of the Atlantic.
It is an impressive world of permanently inundated crevices, plains, scarps and mountains. The ocean floor can be at a depth of 20 meters, at spots close to the continent, or at a depth of 4,000 meters, on the high seas. About 80% of the information used to make the maps was obtained in the last five years, by means of seven cruises carried out by the team from the hydroacoustics laboratory, five of them on board Furg’s oceanographic ship Atlântico Sul. “We used satellite data and occasional measurements made by other ships as a complement to our mapping”, Madureira explains.
The oceanographic ship from Rio Grande do Sul is fitted with a scientific echo probe, a kind of sonar that transmits sound at high frequency and registers the echoes coming from the reflections of the sound waves that hit the bottom of the sea in general, boats use less precise versions of this equipment, which cost about US$ 450,000, to measure the depth of the sea and to identify obstacles or shoals. As it only emits sounds downwards, the Atlântico Sul’s echo probe only records the depth of the stretch of the seabed that is to be found immediately below the ship, but it does so with enormous precision. “The echo probe works in a similar way to the ultrasonography used to see a baby in the belly of a pregnant woman”, is the oceanographer’s comparison.
Installed in the ship’s hull, the apparatus has a sensor that vibrates at a fixed high frequency in the case of the Atlântico Sul, at 38 kilohertz and generates mechanical waves in the direction of the seabed. When they strike an obstacle, usually the bottom of the sea, the waves return to the surface as an echo, recorded in the same sensor of the probe. As the speed of sound in water varies around 1,500 meters a second, the time for the reverberation to return provides the depth of the place immediately beneath the ship. If, for example, the seabed is located 750 meters below a boat, the sound will take roughly one second to come back as an echo.
In the voyages on board the Atlântico Sul, the researchers from Rio Grande do Sul traveled some 16,000 nautical miles (29,200 kilometers) and completely covered the seabed bordering the coast of the southern and southeastern regions and of Bahia. It remains to map the portion of the bed of the Atlantic off the other states of the Northeast, a task that they intend to conclude before the end of this year. “We do not know yet if we are going to carry out the same work in the North, or if this will be done by another research group”, Madureira says. That is why the first maps showing the bottom of the sea still do not cover the Brazilian coast in its entirety. They are limited to showing the portion of the coast that starts in Arroio Chuí, in the far south of Rio Grande do Sul, and goes up to the Real River, on the border between Bahia and Sergipe.
Seen from the perspective of an observer located on dry land, the maps make it clear that the appearance of different contours on the bottom of the sea follows a more or less constant, but not monotonous, order. Stuck to the point of the continent where the sea begins (the coastline), there is, along the shores, the continental platform, which can be described as a submersed plain, inclined at an angle of 5 degrees and at a depth of 200 meters at the most. The distance it extends into the sea can vary from 320 kilometers in Amazonas to a mere 10 kilometers at some points of the Northeast.
Next, there is the slope, at which point the platform breaks off, giving rise to something like a marine cliff, a rocky scarp with a high gradient. From there onwards or rather, downwards – there may be a bit of everything, in accordance with the point on the coast in question: more or less flat areas, small undulations in the terrain, cracks, large and medium chains of mountains. Some submarine mountains can be so high that their tops break the sea surface, forming islands. In the maps, the lightest blue represents areas of the ocean where the bottom is flat, and it can mean both shallow areas (from 0 to 200 meters) and deep areas, at depths of up to 4,500 meters.
The darker blue indicates areas of the ocean that slope steeply, including higher and lower areas.To highlight the variations of contour on the bottom of the sea, the researchers use programs capable of magnifying up to 80 times the variations in depth detected on the ocean bed. This is the way that digital maps are generated, in three dimensions, in which it is made easier, for example, to differentiate between an area of plain with another that has a slight undulation. This is a computer resource with a logic similar to the one used with a microscope in biology, in which, with the assistance of lenses, the size of the object under study is magnified, so as to get to know better the anatomical details.
There are, however, some drawbacks arising from the so-called vertical exaggeration. The peaks of the higher submarine mountains appear in the maps with a more conical look than they really show. “But, unless we use this resource, there is no way of seeing the beginning of a depression in a seabed that is relatively flat”, explains oceanographer Christian dos Santos Ferreira, who has a scholarship from the National Council for Scientific and Technological Development (CNPq), who shares with Sandro Klippel the task of making the computers bring to life the three-dimensional images.
The creation of the maps is a byproduct of work carried out by Furg’s hydroacoustics laboratory for the Program for Assessing the Sustainable Potential of Live Resources in the Exclusive Economic Zone (Revizee). Financed by the federal government, Revizee brings together 150 researchers from 40 Brazilian institutions, with the purpose of dimensioning the stocks of marine fish in an area of the ocean that begins where Brazil’s territorial sea end, 12 nautical miles (22 kilometers) from the coast and extends for another 188 nautical miles (about 350 kilometers) seawards this is what is known as the Exclusive Economic Zone (ZEE).
“When Revizee concludes the data on the marine stocks of the Brazilian coast”, say Madureira, “we will be able to use our digital images to generate three-dimensional maps, with the exact location of the main stocks of fish off the coast, as well as defining more precisely the main currents and the areas with a greater wealth of plankton, those marine microorganisms that live close to the surface.” According to the researcher, this is how it is going to be possible to get a better understanding of how the biological wealth is organized of the Brazilian coast, one of the longest in the world.
Republish