- Interest in the topic of women in science and engineering (S&E)1 is growing. In the USA, the National Science Foundation (NSF) has been monitoring the presence of women in these fields since 1993
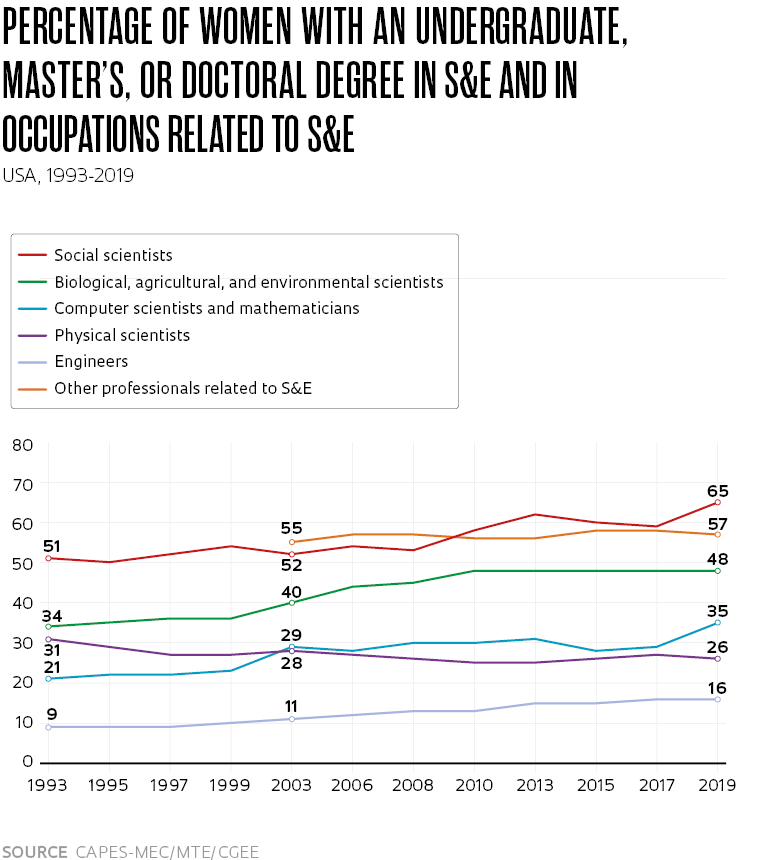
- The graph below shows that women in the country have been playing an increasing role in most occupational groups associated with S&E2
- The two areas with the highest female participation are the social sciences and life sciences and the environment. In the former, the presence of women increased from 51% to 65%, and in the latter, it rose from 34% to 48%
- In contrast, female participation in roles related to computer science and mathematics declined from 31% to 26% over the same period. There was growth in the physical sciences (physics, chemistry, Earth sciences), reaching 35% in 2019
- There was an increase in engineering, but female participation was only 16% at the end of the period, remaining as the field with the lowest proportion of women in areas directly linked to S&E
- In areas of activity related to S&E — including non-researchers, such as doctors, teachers, etc. — with data from 2003 onwards, there is a predominance of women and a slight upward trend in their presence in these occupations (from 55% to 57% in the period)

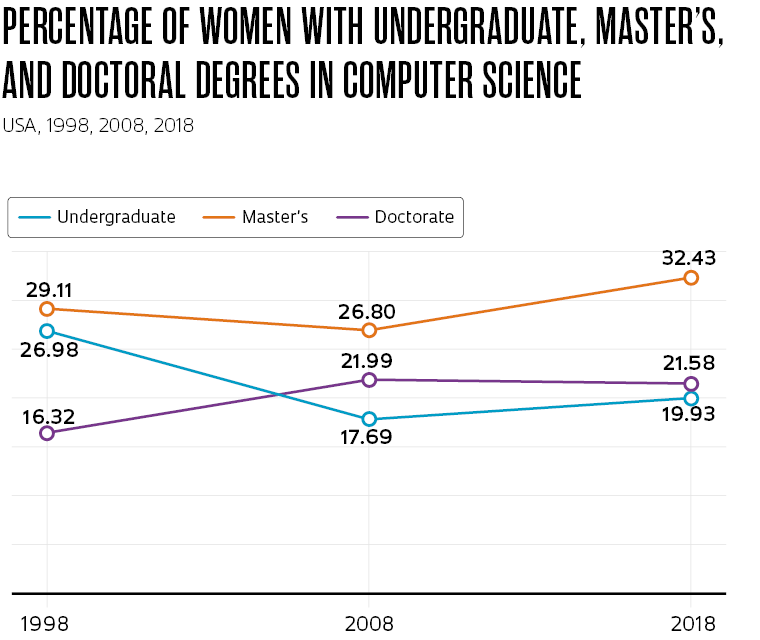
- The lower proportion of women in occupations associated with computer science and mathematics is also reflected in the data on undergraduate and graduate education
- The graph to the right demonstrates low female participation in these fields at undergraduate (just under 20%) and graduate levels in the USA in 2018
- Although the proportion of women on these courses has been increasing since 1998, especially among graduate students, the most recent information illustrates the persistent challenges of attracting women to these fields
- These indicators, despite having been measured and used to evaluate and formulate US public policy for decades, reveal that progress is slow and complex, highlighting the importance of developing similar indicators in Brazil

Notes (1) S&E occupations considered by the NSF are: engineering, computer science and mathematics, life sciences (biology, agriculture, and the environment), physics and related sciences (chemistry and earth sciences), and social and related sciences (economics, political science, psychology, anthropology, etc.) (2) Job positions in S&E shown in the graph 1 caption. In the data on occupational categories, only the occupations of scientists and engineers are considered. The green line shows occupations related to S&E that are not scientists and engineers, such as those associated with health and education. Sources National Center for Science and Engineering Statistics, National Science Foundation (NCSES, NSF) – 2023. Diversity and STEM: Women, Minorities, and Persons with Disabilities. National Science Board, National Science Foundation (NSB, NSF) – 2021. The STEM Labor Force of Today: Scientists, Engineers, and Skilled Technical Workers. Science and Engineering Indicators 2022. NSB-2021-2 Prepared by the FAPESP Studies and Indicators Team (DPCTA)
Republish