

A new method of calculating research and development (R&D) investment in São Paulo has produced a more accurate and comprehensive picture of the amount of effort being devoted to R&D and ultimately to generating scientific knowledge, innovation, and wealth in the state. The new methodology was developed and implemented by the Studies and Indicators department at FAPESP in a collaboration with Fundação SEADE. The redesigned approach conforms to internationally recognized methods, has an expanded coverage of entities engaged in R&D, supports the compilation of new R&D indicators, and refines the methods of compiling research metrics. In the new survey, R&D spend by universities, research institutes, and hospitals in the state amounted to R$12.87 billion in 2018. This is consistent with the R$12.12 billion in R&D investment in the same period as measured by the previous method and reported in FAPESP’s Activities Report, but the new survey is now more accurate and can be used to derive other metrics, such as each sector’s share in R&D funding versus performance (see chart).
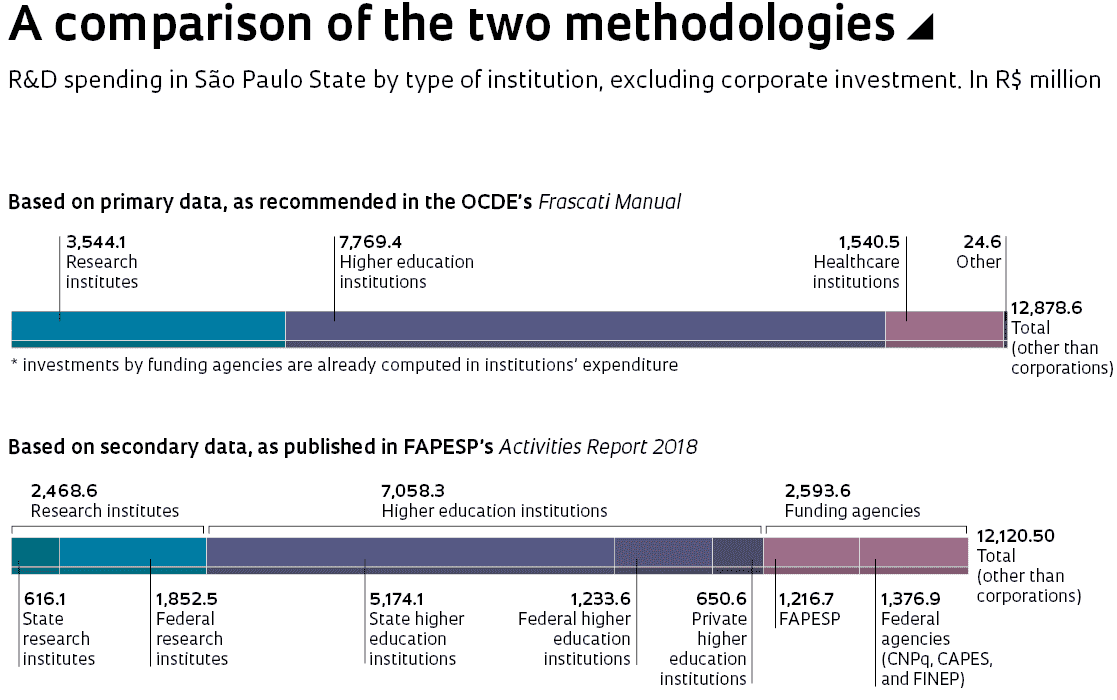
The difference in survey results using the two approaches is explained by three primary factors. The first is that the new approach derives data from primary sources. Institutions engaged in R&D answered electronic questionnaires to provide detailed information about their staff, revenues, and expenses in 2018. This information was then supplemented by and compared against information from public sources about budgets, funding agencies, higher education, graduate education, and other data. The previous methodology relied solely on secondary sources, which in most cases prevented information from being obtained on the sources and amounts of R&D investment.
Secondly, the new survey is more representative than its predecessor. It now covers a larger sample of organizations, including not only state and federal universities and institutes, but also private institutions engaged in R&D and both public and charitable research hospitals.
Lastly, the new method has a refined approach to estimating R&D activity at universities and other higher education institutions. In a collaboration with the Office of the Associate Dean for University Development at UNICAMP, a pilot study was conducted to calculate the amount of time university professors devote to research. This was then used to calculate the proportion of university budgets that can be assumed to be invested in R&D. This approach is consistent with those used in many other countries. The pilot study confirmed what the researchers already knew: most faculty work full-time at their universities, and their duties, on top of research, include lecturing, extension projects, and managerial tasks. But the survey also found that the time they allot to each activity varies across different fields. In exact and earth sciences, faculty dedicate an average of 57% of their time to research, compared to 51% in the humanities and 47% in social sciences. The lowest percentage—40%—was in life sciences. This reflects the requirement for medical-school professors to spend significant amounts of their time in clinical practice, which is not recognized as R&D. These percentages were then applied to other higher education institutions according to the number of faculty in each field. “Better segregation of university R&D has been an important improvement in the method,” explains economist Sandra Hollanda, who helped develop the new methodology and is a consultant to a FAPESP Program that is building a system of Science, Technology, and Innovation metrics.
In determining R&D spending in industry, both methods use the same source: aggregate data about companies in the state compiled from the three-year Innovation Survey (PINTEC) published by the Brazilian Institute of Geography and Statistics (IBGE). R&D spending by companies in São Paulo came to R$12.7 billion in 2018 based on updated data from the latest PINTEC survey, published last April (see Pesquisa FAPESP issue no. 291). The 2018 report based on PINTEC projections had estimated a higher expenditure of R$15.5 billion, which failed to materialize due to the recession.
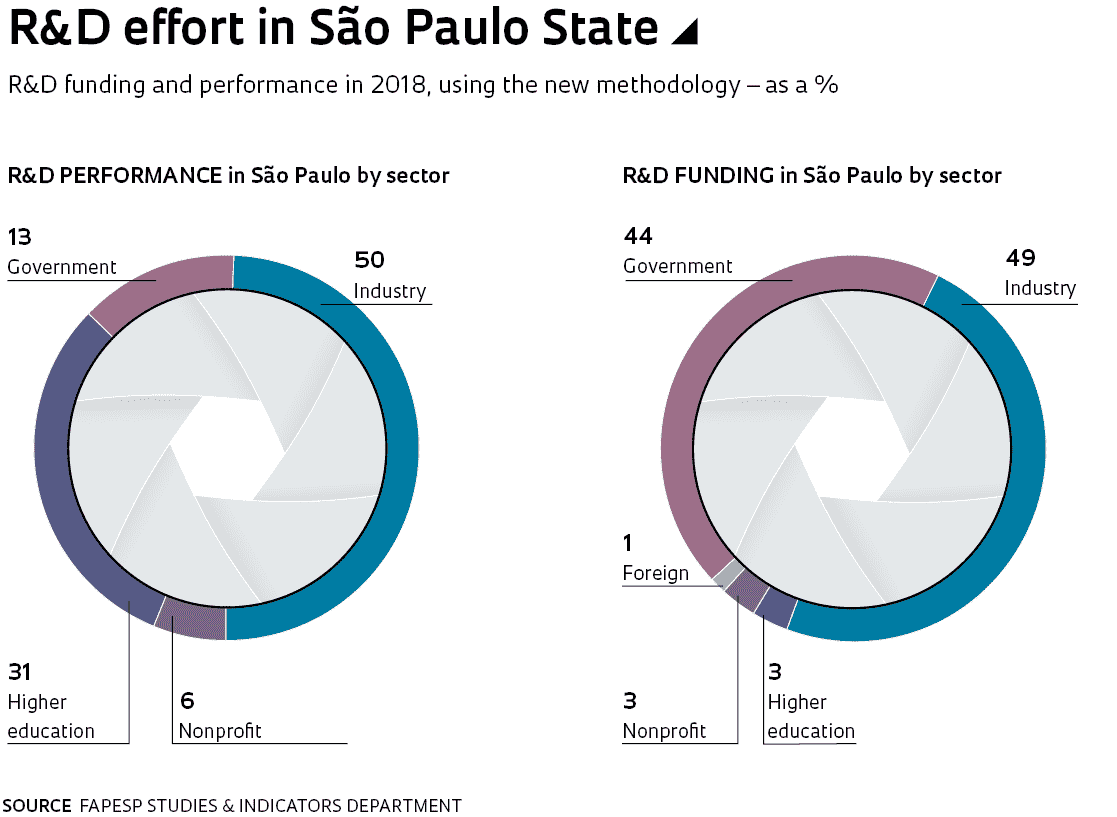
One of the advantages of the new methodology is the ability to separate R&D effort into two different metrics: R&D performance, which shows how much different sectors are engaged in R&D proper; and R&D funding, which measures the share of funding provided by the federal and state governments and by industry, and which organizations are the biggest recipients of that funding. Industry accounted for the bulk of São Paulo’s R&D funding in 2018 at 49% of total expenditure, followed by the government at 44% (see chart). Corporations also had the largest share of R&D performance (50% of the total), with universities accounting for 31%, other public institutions for 13%, and nonprofit organizations for 6%. “These ratios of R&D funding and performance are similar to those in most countries, where R&D at public universities is primarily funded by government, while in-house research at corporations is largely self-funded,” explains Hollanda.
This method of measuring R&D conforms to guidelines issued by the Organization for Economic Cooperation and Development (OECD), a group of the 37 most developed nations in the world. “The criteria we’ve adopted are based on the OECD’s Frascati Manual, a reference guide for R&D statisticians around the world,” explains economist Sinésio Pires Ferreira, head of Studies and Indicators at FAPESP. Another advantage of the survey method is that data is now comparable with international statistics, as most countries have adopted the OECD guidelines. One drawback, however, is that data for São Paulo is no longer comparable to data published by other states or by the Brazilian Ministry of Science, Technology, and Innovation (MCTI), which continue to use secondary sources of information to measure public R&D effort. “FAPESP is considering using the legacy method concurrently to avoid creating a break in the historical series, and to provide data that are compatible with those published nationally, although the approach the MCTI uses is not entirely identical to the Foundation’s previous method,” says Ferreira. The new criteria have now been presented to the MCTI. The reformulated model could be useful to the Federal Government if Brazil were to become a member of the OECD—the accession process is currently underway—and be required to produce OECD-compliant statistics.
Reporting on R&D effort and performance in São Paulo is an integral part of FAPESP’s mandate. Between 1998 and 2010, the Foundation published four books on the subject. R&D statistics have also been published in newsletters and in the DATA section of Pesquisa FAPESP in its more recent issues. In recent years, the Foundation has developed a detailed atlas of science and technology organizations and innovative companies operating in the state, the latter based on PINTEC data. According to the most recent edition of the atlas, São Paulo’s science and technology ecosystem is home to 73 higher education institutions (of which 19 are public institutions (including 4 university hospitals) and 54 are private institutions), 12,831 companies engaged in innovation (including 3,420 with in-house R&D capabilities), 40 public research institutions (including 7 hospitals), and 24 nonprofit research institutes (7 of which are healthcare providers). The atlas provides a trove of data on R&D effort and a more comprehensive inventory of research institutions than in the previous method.
Fundação SEADE, a center for social, economic, and demographic statistics linked to the São Paulo State Government, provided support in developing and implementing the survey. “They have experience of compiling the primary data we needed for the survey,” says Ferreira, who has previously served as the organization’s deputy director. As part of the collaboration, the researchers developed an electronic questionnaire that was modeled after those used in other countries but adaptable to each institution’s available data. “There are differences in the way universities and research institutes are organized and report on their activities. The questionnaire allowed us to compile reliable and standardized information despite these differences,” explains Ferreira. Fundação SEADE’s expertise in working within information confidentiality constraints was also important. Each respondent provided data about its R&D expenditure and effort on the condition that most of the data would only be published in aggregated form. “Many institutions were reluctant to make their data publicly available, so we assured them that the data would only be published in a way that it could not be traced back to them,” explains Ferreira.
Republish