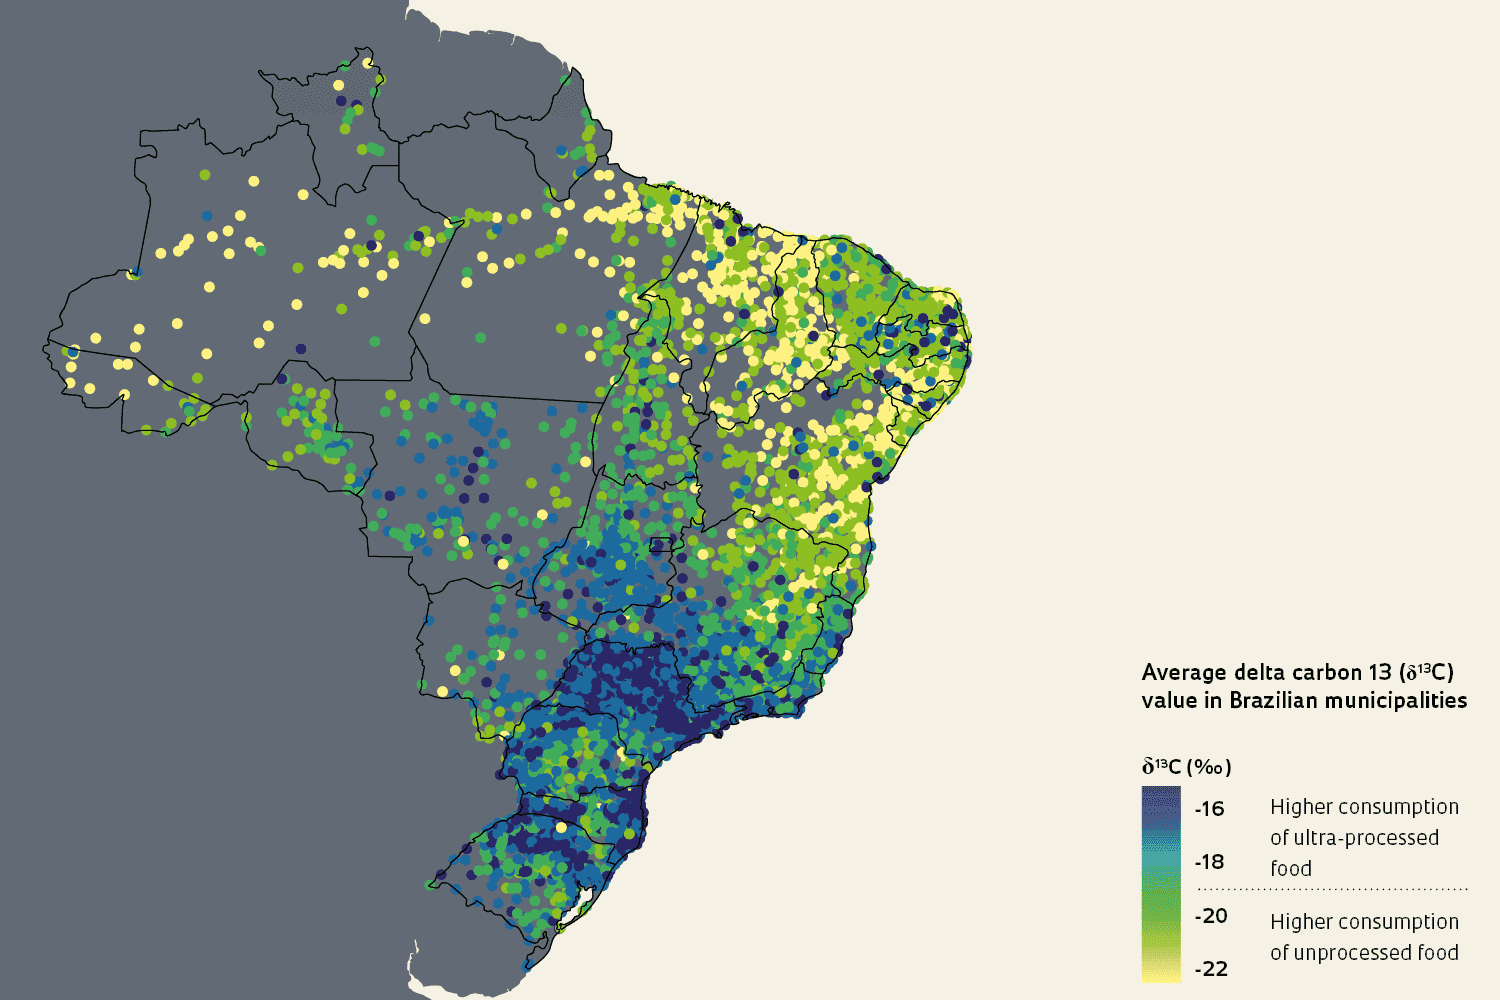
Carbon isotope ratios in Brazilian fingernails indicate the type of diet the individual consumed in the last six months and can be used to estimate the human development index in the city where they live. This is the conclusion of an article published in the journal Science of Food in July. Isotopes are variants of chemical elements that have the same number of protons but differ in the amount of neutrons. The authors of the study analyzed the isotopic composition of fingernail samples from 4,500 individuals from 37 cities in Brazil, home to 10% of the national population, and calculated the average delta carbon 13 (δ13C) for each municipality. High values of this parameter indicate a high consumption of ultra-processed foods, such as processed meat, soft drinks, and ready-made desserts, and low values suggest a greater intake of unprocessed food, such as rice, beans, and cassava.
The researchers then compared the δ13C with the Human Development Index (HDI), which was created by the United Nations (UN) in 1990 and is based on life expectancy at birth, education level, and per capita income, among other factors. Their analysis showed a significant correlation: the higher the δ13C in a municipality, the higher its HDI. The team of scientists used statistical techniques to extrapolate this correlation to almost 99% of the 5,570 municipalities in Brazil and created a map showing the geographical distribution of diets (see on the next page). Nearly 70% of the fingernail samples were collected between 2008 and 2015. Another 23% were obtained between 2002 and 2006, and the rest since 2015.
For biologist Gabriela Nardoto of the University of Brasília (UnB), lead author of the study, the data accurately demonstrates the influence of income on the type of food that Brazilians eat on a day-to-day basis. “Socioeconomic status is closely linked to access to ultra-processed foods. In the South and Southeast of Brazil, the most developed areas with highest HDIs, this trend is evident,” says Nardoto. “In the other regions, which tend to have lower HDIs, there is less purchasing power to buy these products in large quantities.” The Midwest falls somewhere in between. Although this is the major trend shown by the map, the biologist highlights that due to the potentially harmful effects of eating too much ultra-processed food, some of the population with the greatest purchasing power has begun consuming less food of this type in recent years.
All the links identified in the study are based on measurements of two stable carbon isotopes present in human tissue, including in the fingernails: the heavy and rare carbon 13 (13C) and the light and abundant carbon 12 (12C). The ratio of these isotopes can be used to calculate the δ13C of an individual or a population, expressed in negative values permille (‰), and to surmise what their diet might look like. Higher ratios, of between -16 and -18‰, indicate the so-called supermarket diet, featuring a large proportion of industrialized food. Smaller values, between -20 and -24‰, reflect a greater consumption of unprocessed food and fish. “It is not always possible to establish this correlation at the municipal level, because few countries calculate the HDI of individual cities,” says agronomy engineer and study leader Luiz Antonio Martinelli, from the Center for Nuclear Energy in Agriculture (CENA) at the University of São Paulo (USP). “With the database we used to generate our map, we now have an important application that can be used to analyze regional nutrition and monitor dietary changes in a population.”
Forensic tool
The trends identified by the study mirror the results of recent surveys on diets in Brazil, such as the latest Family Budget Survey (POF), carried out between 2017 and 2018 by the Brazilian Institute of Geography and Statistics (IBGE). According to the POF, natural or minimally processed products represent 58.2% of the total calories consumed by people in the North and Northeast. In the South, this figure drops to 47.3%. In the Southeast, it is even smaller, at 44.9%. The Midwest falls in between, with about 50.7% of calories on average coming from this food group.
The survey also found that the intake of ultra-processed foods is higher in the Southeast and South, where it represents 21.4% and 22% of the total calories, respectively. It also measured the consumption of processed foods (breads, cheeses, salted meats, and fermented drinks) and culinary ingredients (vegetable oil, sugar, starch, animal fat). Together, these two categories represented 28–35% of the calories consumed in the major regions of Brazil. “Despite using a very different methodology to the Science of Food study, the POF survey also shows that consumption of unprocessed food falls as income increases, and consequently, the consumption of ultra-processed food rises as purchasing power increases,” notes nutritionist Daniel Bandoni, from the Institute of Health and Society at the Federal University of São Paulo (UNIFESP).
According to Nardoto, the data used to create the map of predominant diets in Brazilian municipalities could be useful to studies in other fields, such as forensics. “The carbon isotope analysis technique can be used to refine the geographic origin of an unidentified skeleton,” says Nardoto. “The method cannot identify where an unknown corpse comes from all on its own, but it can narrow it down.” In such a case the δ13C of an individual would function as a kind of isotopic fingerprint associated with a specific region.
Project
Isotopic mapping of diets in Brazil – From the most isolated regions to major urban centers (no. 11/50345-9); Grant Mechanism Regular Research Grant; Principal Investigator Luiz Antonio Martinelli (USP); Investment R$150,733.76.
Scientific article
NARDOTO, G. B. et al. Increased in carbon isotope ratios of Brazilian fingernails are correlated with increased in socioeconomic status. Science of Food. July 16, 2020.