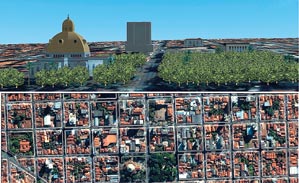
Associated ScientistsImage of the city of São Carlos in 3D, above, and the satellite image: different viewsAssociated Scientists
The Brazilian hydroelectric system, based mainly on hydroelectric power plants, generated 416 thousand gigawatts/hour in 2006. Of this total amount, approximately 21% was lost during the generation, transmission and distribution stages. Part of these losses could have been avoided if the 64 distribution companies operating in Brazil resorted to more sophisticated software that would help speed up decision-making, and reverse the system’s technical and operating failures. The good news is that as of July this year, Cientistas Associados Desenvolvimento Tecnológico, a technological company located in the city of São Carlos, State of São Paulo, will offer a new application that will help the utilities plan and manage their operations more efficiently. This application is a computer system that displays images in three dimensions; it is based on the geographic information system/SIG, which creates a virtual, interactive and geo-referenced environment on the computer screens of the operators responsible for the management of the national electric system. SIGs are automated systems used to store, analyze and manipulate geographical data.
Named ENS3D (for energy network system 3D), the software provides views of three environments. The first environment, named unit-line or themed environment, is a representation of the electric grid in a specific region. It provides a detailed view of all the network’s elements (poles, transformers, switches, cables and transmission lines), displayed in the form of circles, squares and lines. The second environment is a city’s two-dimension navigational map, which provides the geographical location of that which is being displayed in the themed diagram. The backdrop of this map is a photo of the QuickBird, a U.S. satellite that provides high-resolution images of the earth’s surface. The third environment, the SIG 3D, is a three-dimensional mock-up of the city. This device provides the technician with a real image of the place being analyzed. In addition to getting information such as latitude and longitude, the technician is able to see the details of the related terrain (elevations, depressions, etc.) and construction in the region. The application’s innovative features include an integrated user-computer interface/IHC. The IHC is a field of information technology which studies the best way for the computer and software to relate to and interact with each other. The three environments are synchronized and, when one environment is moved, the other two also move in a geo-referenced manner.
“The main advantage of our application is that it facilitates the viewing of complex situations, which could only be viewed before by resorting to a large volume of maps or documents. Because it allows for a better understanding of the existing spatial relation between the elements of the analyzed electric power system, it enables the user, in an interactive manner, to interpret a large quantity of information speedily and more accurately,” explains Antônio Valério Netto, the founder of the company and the leader of the group that created the application. Hence, it is possible to make more contextualized decisions, with lower risk of incurring error. “Costs drop when less mistakes are made,” says Valério.
Flow and fraud
An example of a decision to be made based on information from the ENS3D is the switching on or off of the switches that control the flow of electric power through the grid. “The speedy identification of the spatial context of the location of the electric elements in the city’s electric power distribution system, such as street names or names of reference buildings, is essential to make decisions correctly. The conventional software currently being used by the utilities does not offer the wealth of geographic information offered by our software,” says Valério Netto. The application can also help electric power distributors inspect the network and deal with fraud. “The application creates maps showing these frauds; in this way, the manager can design a more efficient and less costly action plan by taking into consideration the spatial distribution of the events.”
The software, Valério Netto emphasizes, is a unique concept (three integrated, geo-referenced interfaces with a three-dimensional environment) and has no competive products in Brazil. He adds that many of the programs used by the electric power companies were developed in the 1980’s and the 1990’s, and this is why they have interfaces with limitations for content exposure. “Only a few distributors have solutions with SIG 2D; no distributor uses the SIG 3D. The major difficulty in implementing an SIG system lies in the costs and terms. Normally, this is an upper-level management decision, made by the president or by the executive officers,” says the owner of Cientistas Associados, a company located at the Centro Incubador de Empresas Tecnológicas/Cinet incubation center at the Fundação Parqtec foundation, which brings together software and hardware specialists to work on distinctive projects with innovation objectives (see Pesquisa Fapesp Nr. 118).
It took two years to make the ENS3D. The software was developed by a multi-disciplinary team comprised of information technology researchers from the fields of software engineering, intelligent systems and IHC, electric engineers, map engineers and an architect. The project was funded by FAPESP by means of the Programa Inovação Tecnológica em Pequenas Empresas/Pipe funding program. The objective of the business model adopted by Cientistas Associados is to provide technology, consulting, and implementation services. Several events were held before the end of October to show the technology to the utility companies. Besides helping manage the electric power sector, the software can also be used for other purposes, such as urban planning, improving the traffic system, environmental impact analysis, infra structure planning and monitoring of water supply and sewage systems. “We have already shown our product to three water supply utilities in the State of São Paulo and to a number of local urban development and housing government authorities. We were also contacted by a number of high-end gated communities,” says Valério.
The researcher cum businessman is optimistic in relation to the success of the product. He believes that by the end of 2008, sales of the software and the services package will generate revenues of R$ 1.2 million. “We detected an unexplored market niche in Brazil and in Latin America – namely, the SIG 3D market – and we decided to place our chips in this market,” says Valério Netto. “We have worked to publicize the 2D and 3D technology so that it will account for at least 40% of our sales in the next two years. The SIG projects have high aggregate value and can be integrated with other management applications that already exist in private sector companies and government entities,” he adds.
The Project
Computer system to reduce losses in electric power distribution networks with virtual reality interface (nº 02/07862-3); Modality Programa Inovação Tecnológica em Pequenas Empresas/Pipe technological innovation program for small businesses; Coordinator Antônio Valério Netto – Cientistas Associados Desenvolvimento Tecnológico; Investment R$ 264,328.90 (FAPESP)