- R&D expenditure at universities in the US has grown rapidly since 20151
- From 2017 to 2018, total R&D expenditure rose from US$75.3 billion to US$79.4 billion (R$161 billion)2
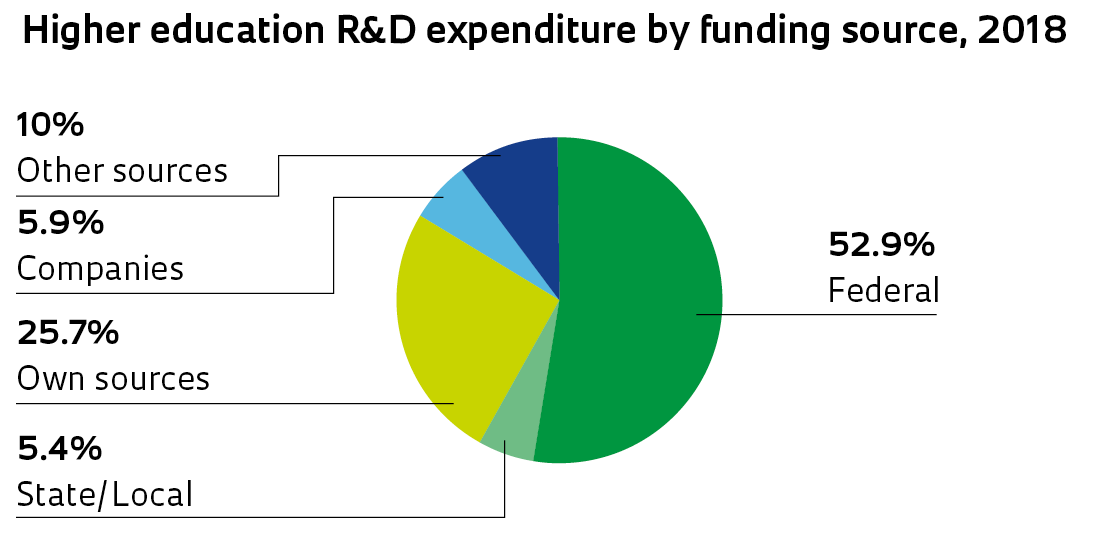
- The federal government funded 53% of higher education R&D, while state and local governments funded 5.4%
- Research funded by the universities themselves, including from equity funds and other sources, accounted for 26%
- Private companies provided 5.9% of all funding3

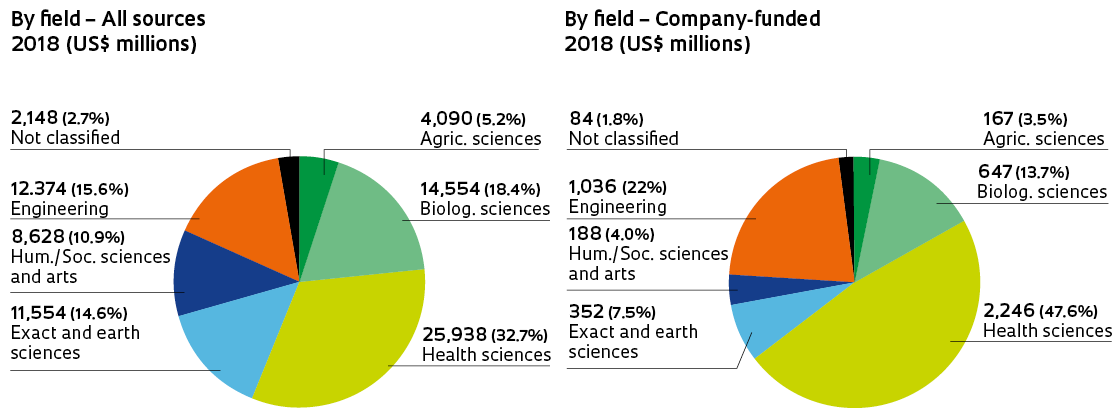
- In 2018, health sciences led R&D expenditure at universities (33%), followed by biological sciences (18%), engineering (16%), exact and earth sciences (14%), human/social sciences and the arts (11%), and agricultural sciences (5.2%)
- For research funded by companies, health sciences is even more prominent, at 48%, and engineering increases from 16% to 22%
Notes (1) Corrected for inflation according to the “US Bureau of Labor Statistics” index, which was 5.6%, between 2015 and 2018. (2) Conversion from reais to dollars using the 2018 Purchasing Power Parities Index ($PPP) of 2.029, OECD. (3) In this and other graphs, the sum of all values may not be exactly equal to the total, due to rounding. (4) The data in this section include institutions with at least US$1 million in R&D expenditure. The total amount is US$79.286 million, US$150,600 below the total of US$79.436 million from the previous section. (5) The fields of agricultural sciences, biological sciences, and health sciences are integrated into the broader heading of “Life Sciences” by the NSF.
Sources National Science Foundation, Tables 1, 12 – https://ncsesdata.nsf.gov/herd/2018/. OECD, $PPP – https://data.oecd.org/conversion/purchasing-power-parities-ppp.htm. Bureau of Labor Statistics, USA http://data.bls.gov/cgi-bin/cpicalc.pl.
Republish