
Published in October 2012
 NASA / JPL-CALTECH IMAGE IGNACIO TOLEDO / VVV SURVEY / ESOAstronomers’ demands for high-definition images far surpass those of any movie aficionado. To determine the maximum number of visible stars in what is known as the galactic bulge – the inner portion of our galaxy, the Milky Way, and the location of the greatest concentration of stars – an international team of 12 researchers, led by Brazilian Roberto Saito and Argentinian Dante Minniti, both from the Pontifical Catholic University (PUC) of Chile, analyzed the 190,000 by 170,000 pixel picture of this region shown on these pages. The image, produced by Chilean astronomer Ignacio Toledo of the Alma Observatory, is so large that it would take 6,000 HDTVs to display it at full resolution.
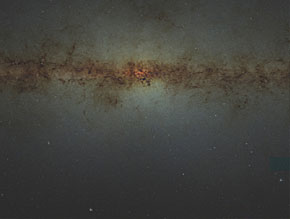
This photograph of the heart of the Milky Way reveals a population of stars in which planets similar to Earth can be found and promises to help us understand how the galaxy was born. It also strengthens the hypothesis that there are two large regions with a high density of stars in the form of a large X in the galactic bulge, the central region that is shaped like a football. The analysis of the new image produced a catalog of information on the position and brightness of 84 million stars. Larger surveys have been carried out, but according to Saito, no one has ever before analyzed such a large number of stars at one time.
At maximum resolution, the new image occupies 200 gigabytes of computer memory. Because of the amount of data, no Internet connection was large enough to transfer it error-free from Chile – where it was obtained over the course of more than a year of observation by the four-meter telescope Vista at the European Southern Observatory (ESO) – to the UK, where it was synthesized by researchers at the University of Cambridge. Therefore, it had to be transported there and back by plane.
From the new catalog of stars in the bulge, the research team – which includes Brazilian astronomers Márcio Catelan, from PUC Chile, and Beatriz Barbuy and Bruno Dias, from the University of São Paulo – has produced a graph called a color-magnitude diagram that correlates the intensity of star brightness with the color of its light. This graph was published in Astronomy & Astrophysics in August of this year. By studying the distribution of the stars in this diagram, astronomers are able to infer the mass, age and location of the stars in the galaxy and describe the population of stars in the bulge.
The 84 million stars in the catalog are a tiny fraction of the hundreds of billions of stars in the Milky Way. More than a third of them are clustered in the bulge, while the rest, including our Sun, are located in the spiral arms that form the outer part of the galactic disk.
It was not easy to see the stars in the bulge. They are not very bright, they are highly concentrated, and the light they emit is blocked by an enormous amount of gas and dust. The Vista telescope was only able to detect so many because it can capture the infrared radiation emitted by the stars that manages to penetrate the fog of gas and dust. “Only infrared surveys can see the bulge, and therefore, they are fundamental to understanding how the Milky Way formed,” says Kátia Cunha, an astronomer at the National Observatory and an expert on the subject.
A star census
The researchers confirmed that most of the bulge stars are red giants, elderly stars in the last stages of their lives, which is consistent with the widely accepted idea that the bulge was the first region of the galaxy to form. The red clump giants, a type of star with well-known color and brightness, stand out among these red giants. “That means they can be used as distance indicators,” says Saito. “If they are not very bright, this indicates that they are far, and if they are bright, it is because they are close.”
Using the red clump giants, Saito and his colleagues mapped the bulge and confirmed the findings of previous surveys: the center of the galaxy contains two regions in which there is a higher concentration of stars. Each of these regions is shaped like a bar, and they cross in the form of an X. However, the researchers found something new: the extremities of the X are much longer than previously thought.
The astronomers also identified a series of red dwarf stars that were beyond the detection limits of previous surveys because of their faint brightness. “They are small, one tenth the size of the Sun and are believed to be the most common stars in the galaxy,” says Saito. According to the researcher, the red dwarfs are currently of interest because it is easy to detect small, rocky planets similar to Earth around them. Through 2014, the Vista telescope itself will look for changes in the brightness of these stars caused by planets crossing in front of them.
“Today, there are at least two scenarios that explain the formation of the bulge, which, in turn, may provide an explanation for the formation of other parts of the galaxy,” says Brazilian astronomer Cristina Chiappini of the Leibniz Astrophysics Institute in Potsdam, Germany. One view is that the bulge may have formed by clumping together smaller galaxies in the first billion years of the universe. The alternative explanation is that the formation of the bulge was slower because of instabilities in the rotation of the galactic disc, where there are more gas, dust and young stars. “The important thing is that the different scenarios suggest the emergence of stars with different chemical and physical properties,” says Chiappini.
She and Cunha emphasize that the catalog produced by Saito and his colleagues paves the way for large-scale spectroscopic surveys of the chemical composition of a large number of stars simultaneously, thus providing data to test theories about how the Milky Way may have formed.
Scientific article
SAITO, R. K. et al. Milky Way demographics with the VVV survey I. The 84-million-star color-magnitude diagram of the galactic bulge. Astronomy & Astrophysics. Aug. 28, 2012.