It is difficult to recall a time when mathematical modeling of infectious diseases gained as much visibility and interest as it has in the current crisis. “This likely reflects the sense of perplexity created by the epidemic—nobody was expecting it to be so devastating,” says epidemiologist Eduardo Massad, who took a position last year as a professor of applied mathematics at Fundação Getulio Vargas (FGV), after retiring from the University of São Paulo School of Medicine (FM-USP).
“Never before has modeling been as necessary as it is now in dealing with such a rapidly escalating epidemic,” adds public-health physician and epidemiologist Hélio Neves, a professor at the School of Medical Sciences at Santa Casa São Paulo (FCM-SC-SP) and chair of the Technical-Scientific Committee on Covid-19 at the São Paulo Department of Health.
– The reality of data
– Natural guests
– Brazil begins testing
– Sergio Machado Rezende: Together against COVID-19
– Restoring trust
– Calculating in the dark
– The size of the pandemic
– The child enigma
– Research during the quarantine
Although all models involve uncertainty, as the dynamics they describe are fluid and the data they rely on are incomplete, their ability to make predictions of cases or deaths is supported by at least 250 years of cumulative research.
It was Dutch mathematician and physicist Daniel Bernoulli (1700–1782) who developed the first mathematical model of the spread of infectious diseases, in an attempt to demonstrate the effectiveness of preventive inoculation against smallpox, then a widespread disease in Europe.
Bernoulli published his ideas in two articles in 1760, one in the journal Mémoires de mathématique et de physique and the other in Mercure de France, using the same parameters used today to predict the progression of epidemics.
Bernoulli divided the population into two groups: susceptibles, i.e. those who have not yet been infected, and immunes, i.e. those who have been immunized after infection. His equations used three variables by which people move from the first to the second group. The first was the disease-reproduction rate or force of infection, which describes transmission from infected individuals to susceptible individuals. The second was the case fatality rate, and the last was life expectancy at the time of infection. His calculations assumed the immunization rate would be 100%—inoculations were administered using a bifurcated needle—and that there would be no risk of virus transmission from inoculated individuals to susceptible individuals. He concluded that inoculation could increase life expectancy from 26 years and 7 months to 29 years and 9 months.
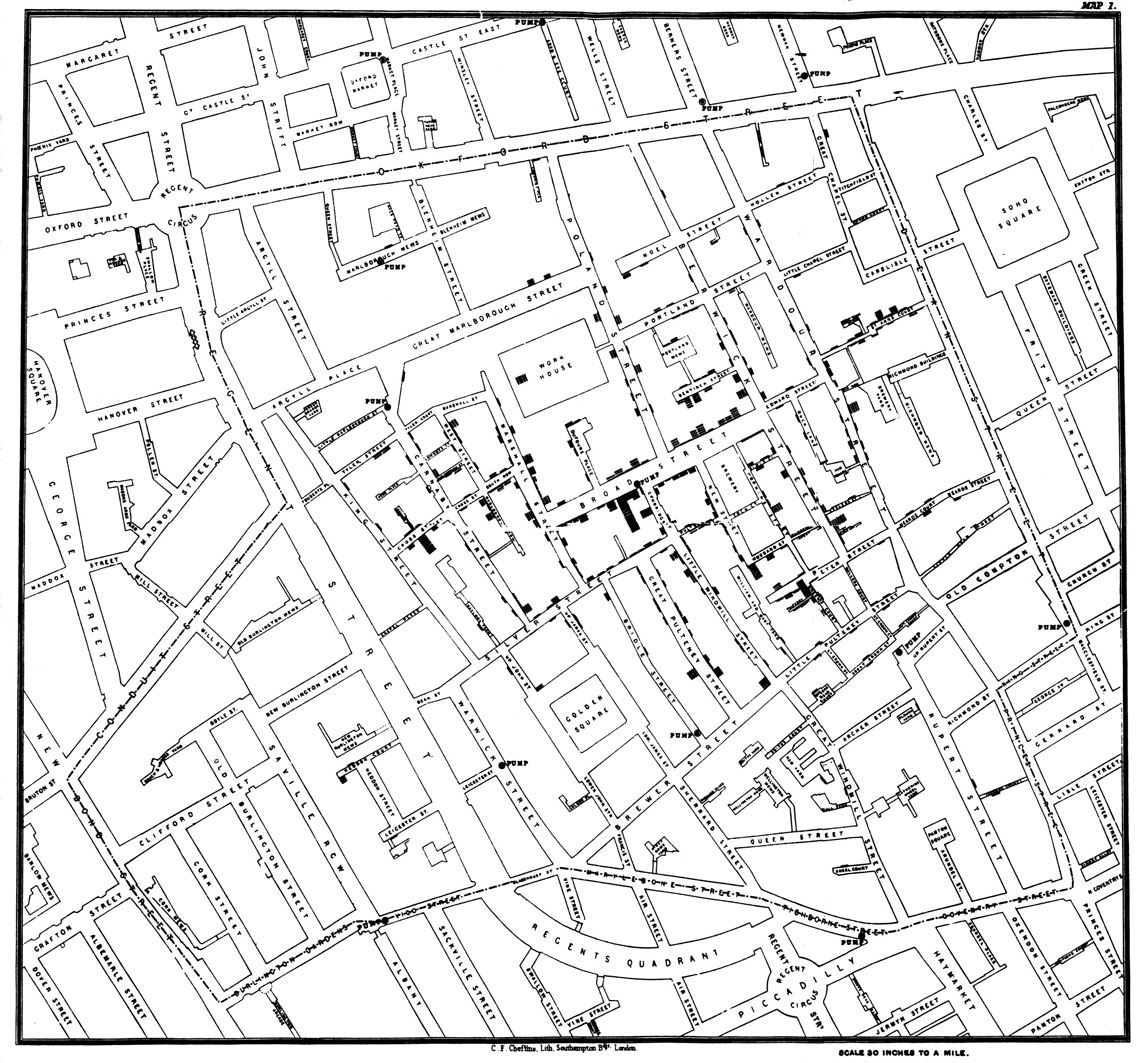
Snow, J. On the Mode of Communication of Cholera, 2nd Ed., John Churchill, New Burlington Street, London, England, 1855 / Wikimedia
John Snow’s original map of the London district of Soho, in 1854. The black squares and rectangles represent homes where people contracted choleraSnow, J. On the Mode of Communication of Cholera, 2nd Ed., John Churchill, New Burlington Street, London, England, 1855 / WikimediaCholera in London
The cholera outbreak in London in 1854, which killed 127 people over the space of three days in early September, revealed the importance of supplementing mathematical modeling with investigation on the ground. English anesthesiologist John Snow (1813–1858), though not a trained epidemiologist, was able to trace the outbreak to contaminated water from a pump on Broad Street, now renamed Broadwick Street. His theory conflicted with his colleagues’ and government authorities’ belief, under the influence of miasma theory, that the disease had been caused by the city’s foul air.
Snow created a map showing that the homes of those who had died were near the contaminated pump. The map led reverend Henry Whitehead (1825–1896) to embrace Snow’s theory of waterborne transmission and to set out in search of the index case—the first case of the disease—so he could then trace the path of transmission, aided by his familiarity with the district of Soho, where the outbreak had begun. “Whitehead ultimately supplied [Snow] the crucial evidence for establishing the pump’s role” in the cholera outbreak, American linguist Steven Johnson wrote in the book The Ghost Map (Zahar, 2008).

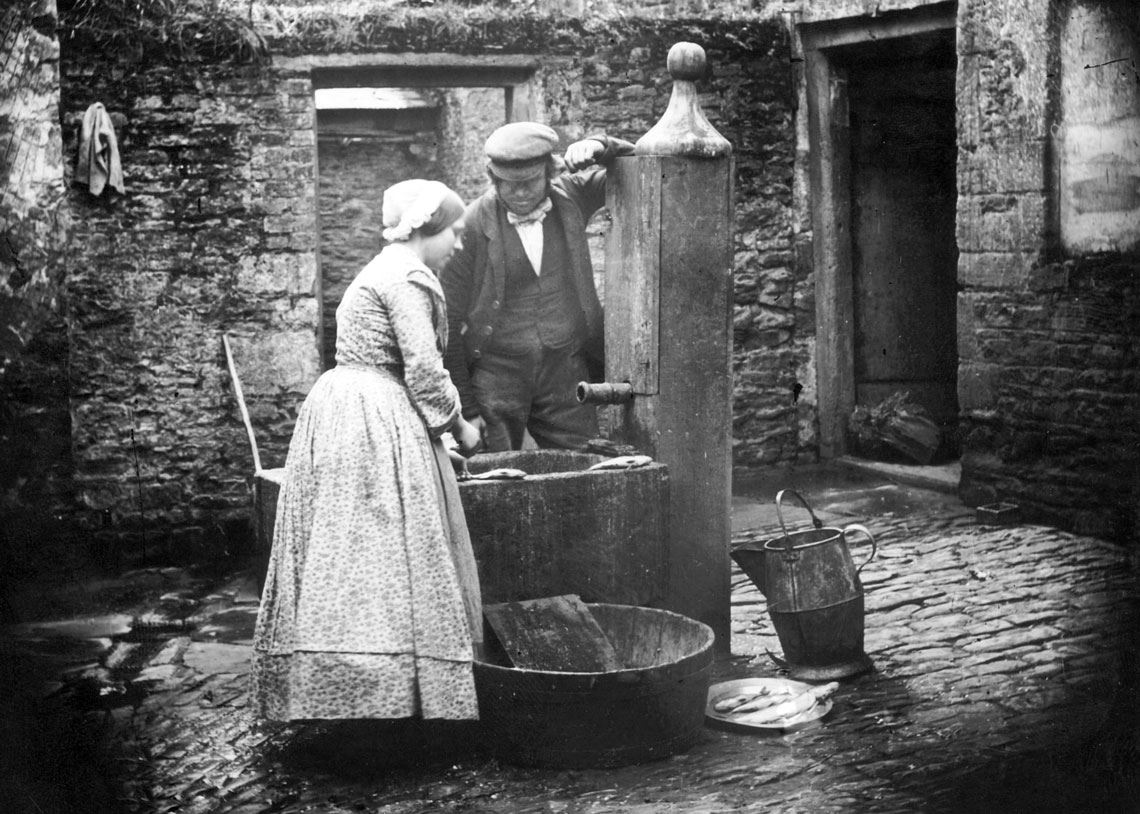
Justinc/WIKIMEDIA
Street pumps like the one pictured here helped to spread cholera bacteria in mid-nineteenth century LondonJustinc/WIKIMEDIASnow died of a heart attack at 45 years of age, without receiving recognition for his ideas. Whitehead would go on to investigate another cholera outbreak in London, in 1866, this time in the company of British epidemiologist William Farr (1807–1883), one of the founders of medical statistics. With his knowledge of Snow’s ideas and as a member of the government’s health committee, Farr investigated the water supplied by two companies to residents in the city. On discovering that one company was supplying contaminated water, he immediately ordered that notices be posted in the area advising residents not to drink any water which had not been previously boiled.
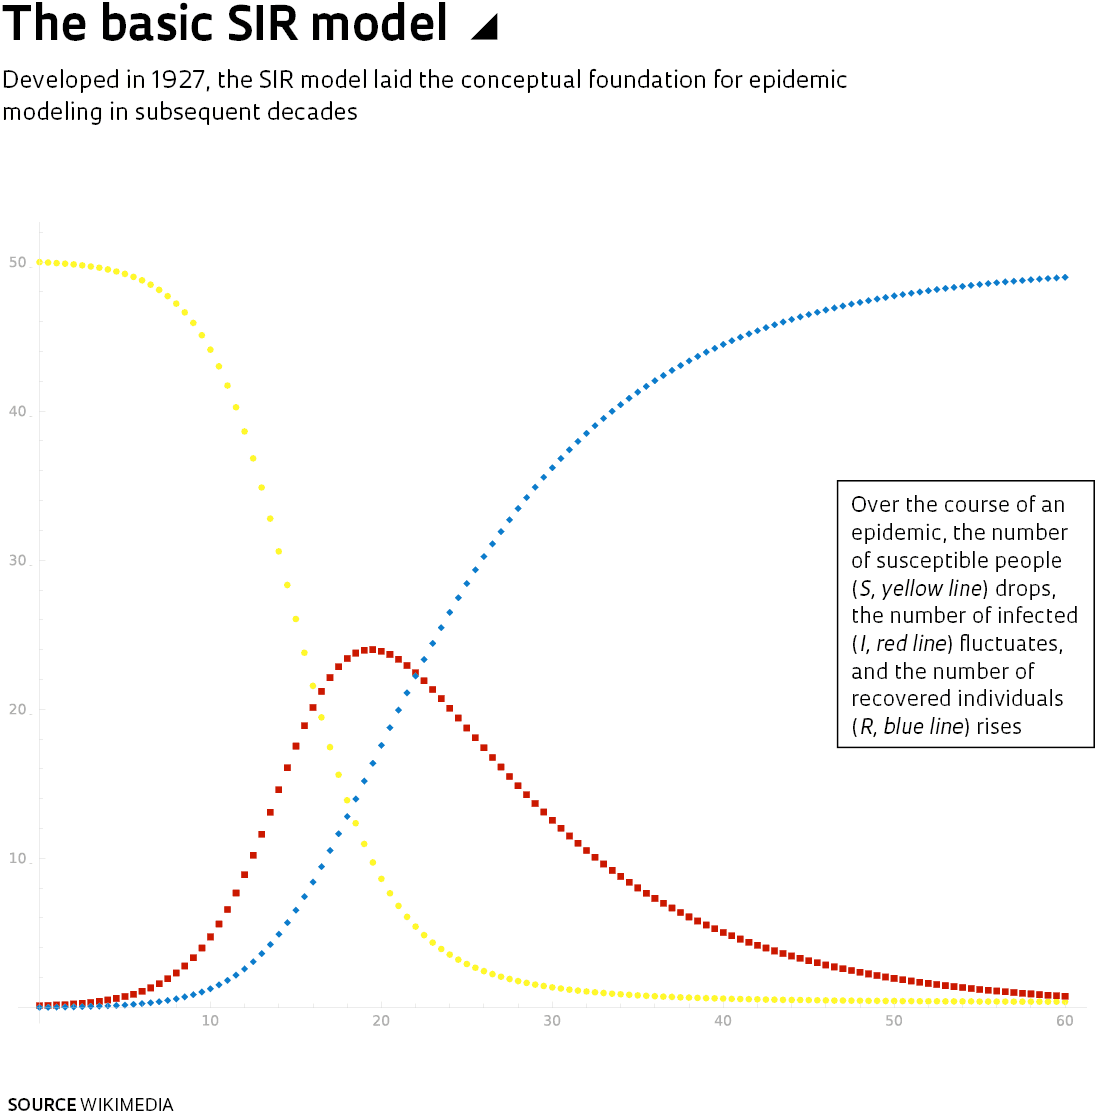
Biochemist William Ogilvy Kermack (1898–1970) and epidemiologist Anderson Gray McKendrick (1876–1943) of the Royal College of Physicians, in Edinburgh, later developed a theory of disease transmission that they presented in a 1927 article in the Proceedings of the Royal Society A. This theory laid the groundwork for today’s modeling methods. Their SIR model, named after the initials of three groups—susceptibles, infected, and recovered—built further on Bernoulli’s earlier concepts. During an epidemic, people move from one group to the other when an infected individual transmits the disease-causing agent to a community of individuals who are more or less susceptible. An epidemic spreads at a rate depending on the transmission rate and case fatality rate—which vary over the course of the epidemic—and ends when susceptibles are infected and either recover and become immune, or die.
The SIR model has since been refined, especially since the 1970s with the introduction of computerized mathematical modeling. The R now stands for “removed” to include not only those who have recovered, but also those who have died.
Using these concepts, since 1980 Massad has investigated the mechanisms of transmission of malaria, measles, dengue fever, yellow fever and, more recently, Severe Acute Respiratory Syndrome (SARS), Zika, and other infectious diseases, often developing new strategies for prevention. In 1992, his calculations helped the São Paulo State Department of Health (SES-SP) to save around US$15 million by vaccinating only children aged 1 to 10, rather than following the Pan American Health Organization’s (PAHO) recommendation of vaccinating the entire population between 9 months and 15 years of age with a trivalent vaccine against measles, mumps, and rubella (see Pesquisa FAPESP issue no. 8). São Paulo’s strategy, which was explored in detail in a 1993 article in Epidemiology & Infection, proved successful.
“We still use the SIR model, but with many more compartments”, explains physicist Roberto Kraenkel, a professor in the Institute of Theoretical Physics at São Paulo State University (IFT-UNESP). He, along with colleagues at USP and the Federal University of ABC (UFABC), have been tasked with coordinating the COVID-19 BR Observatory, an online platform launched on March 15 to track case numbers in Brazil. “We divide the population into compartments defined as susceptible, exposed but not infectious, and infectious, with the latter compartment further divided into mild or severe cases, and individuals hospitalized or not hospitalized. Last comes the removed compartment—individuals who have either become immune or have died,” he explains.
The Observatory team currently consists of 40 researchers based in Brazil, the US, and Germany. “They are very quick to respond,” says Neves, of Santa Casa and the Municipal Health Department, who is responsible for providing data about reported cases in São Paulo City. “I present them with a problem, they do the calculations and estimates, and have results within three hours.”
Case and death projections, he says, have informed the expansion of testing laboratories and hospital beds, the use of schools and sports centers to accommodate people with the milder form of COVID-19, and the management of public cemeteries. “Municipal hospital occupancy rates have remained below 60% as we have consistently expanded our bed capacity,” says Neves. “The biggest problem is not knowing when the epidemic will peak.”
One of the Observatory groups worked to identify the cities in Brazil’s three southern states and nine northeastern states that are at greatest risk of virus spread from the country’s epicenter states of São Paulo, Rio de Janeiro, and Minas Gerais, based on road traffic. The studies were published in April as a preprint in the online science library SciELO.
“The potential for virus spread depends as much on the size of the city as on the number of road or bus links to other cities,” says ecologist Paulo Guimarães, a researcher at the Institute of Biosciences at USP, who is coordinating analysis efforts in São Paulo. That is why Campinas and São José do Rio Preto, with their links to respectively 214 and 135 other cities, are more vulnerable than their size would suggest.
“Networking among experts in different fields has been highly productive,” says epidemiologist Maria Amélia Veras of FCM-SC-SP, who is collaborating with the Observatory by analyzing data and submitting conclusions. “Modeling can also be used to approximate reality based on parameters known from similar diseases,” she explains. For example, a group of epidemiologists at Oswaldo Cruz Foundation used data from an influenza database in Brazil, Infogripe, to model the behavior of the COVID-19 pandemic. Another group, at the University of Brasília, adapted a mathematical model used during the measles pandemic to measure the extent of the coronavirus pandemic in Greater São Paulo.
“The biggest limitation of models is the quality of the information they are fed with, as we are dealing with phenomena that are highly fluid,” says Veras. Although there is evidence that COVID-19 symptoms are less severe in people under 60, the rate of transmission across different age groups and the precise number of people infected remain unknown, since only hospitalized patients are being tested.
Another problem creating uncertainty in modeling results is that the initial rate of transmission, known as R0, morphs into the effective rate, Re, later in the course of the epidemic. Values higher than 1 indicate that case numbers are increasing, values approximating 1 indicate they are stable, and values lower than 1 show they are retreating.
Toward the end of April, the Re value for São Paulo was around 1, which means each individual was transmitting the virus to one other individual, on average. “We are at a point where new case counts have plateaued but are still high at around 100 to 200 new severe cases in São Paulo each day,” says ecologist Paulo Inácio Prado, a professor at USP and one of the coordinators of the COVID-19 Observatory. “The situation is less than ideal, but still better than the exponential growth we saw in the first fortnight of March, when our Re value was between 2 and 3.”
A large backlog of diagnostic tests awaiting processing means the true size of the pandemic in Brazil remains unknown. “The testing bottleneck leads to underreporting and makes the pandemic seem slower in the models than it really is,” says Kraenkel.
“We adjust the models as the data comes in, but there is always a huge risk of error,” says Massad. It is likely that the extent of the pandemic will only be known at least a year after it is over based on seroprevalence, or the proportion of people who test positive for coronavirus antibodies in relation to the number of reported infection cases.
Scientific article
BERNOULLI, D. Essai d’une nouvelle analyse de la mortalite causee par la petite verole et des avantages de l’inoculation pour la prevenir. Mémoires de mathématique et de physique, presentés à l’Académie Royale des Sciences. n. 1. 1760.
JOHNSON, S. The Ghost Map: The Story of London’s Most Terrifying Epidemic and How It Changed Science, Cities, and the Modern World. Rio de Janeiro: Zahar, 2008.